


There won't necessarily be a new chart every day, but we will do at least 1 to 3 per week.
After a Covid Hiatus, we are back
April, 27, 2022
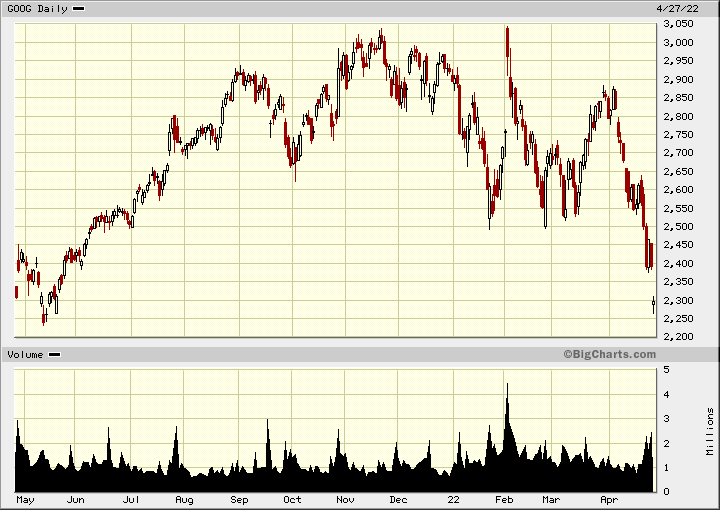
In a recent comment I suggested all the high flying techs would get hammered and pointed out that Google and Amazon would soon be the next to fall. Google, another one biting the dust.Get out of Amazon and all the Fang stocks, they will go a lot lower.
April, 26, 2022
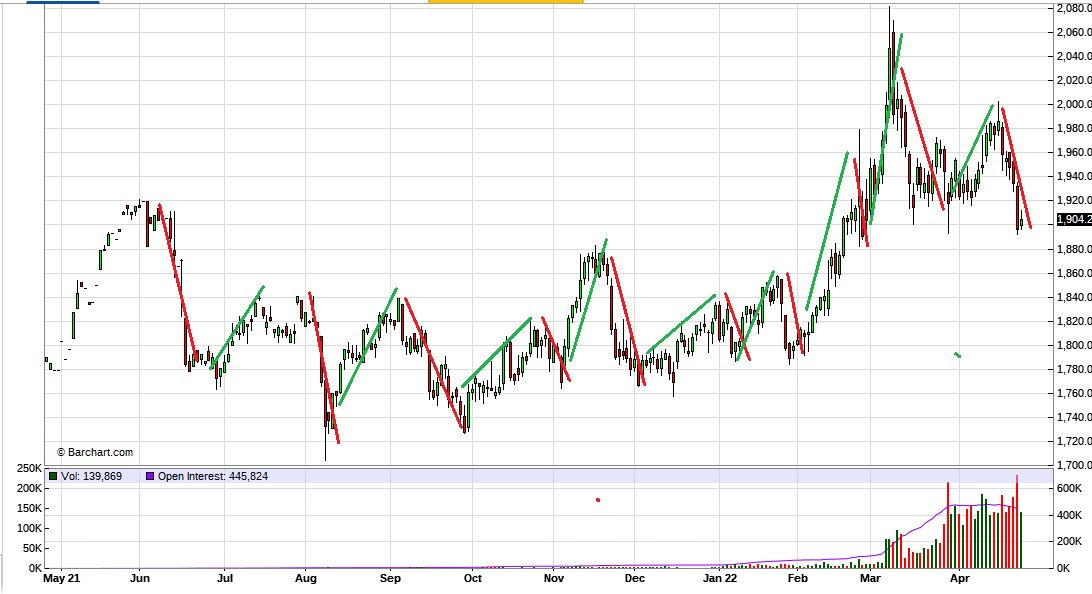
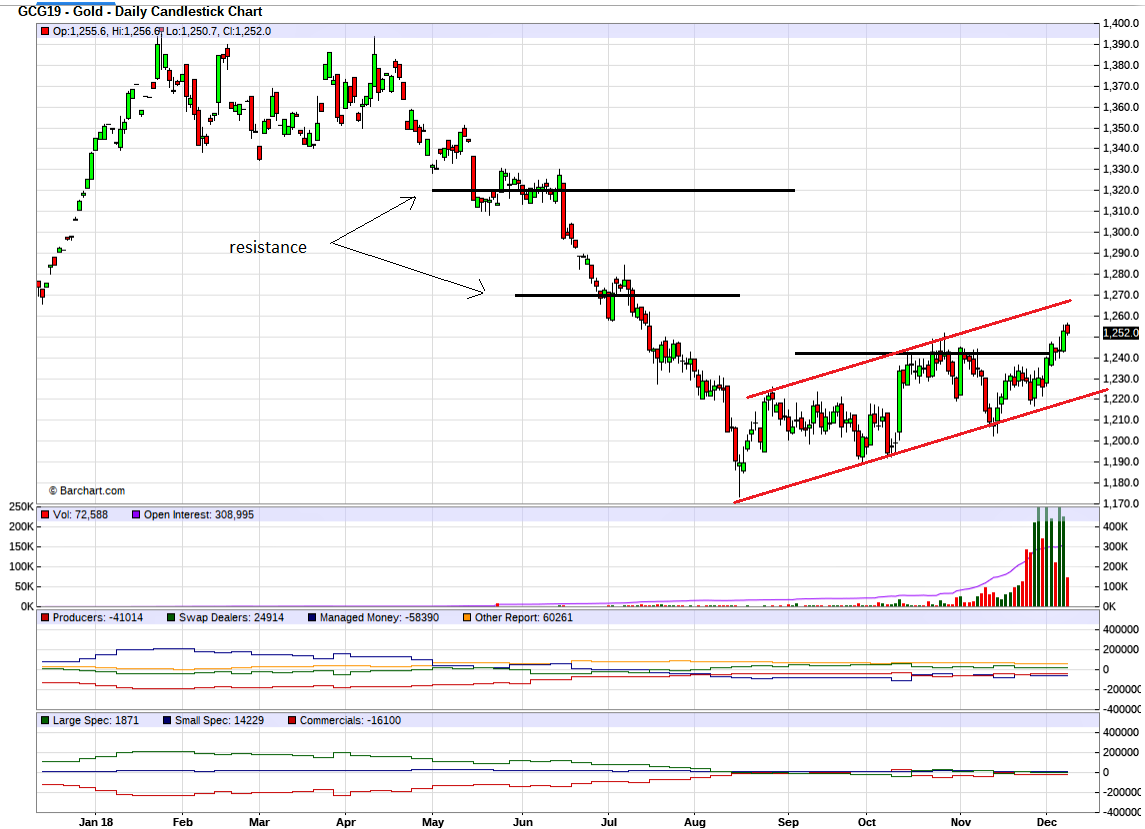
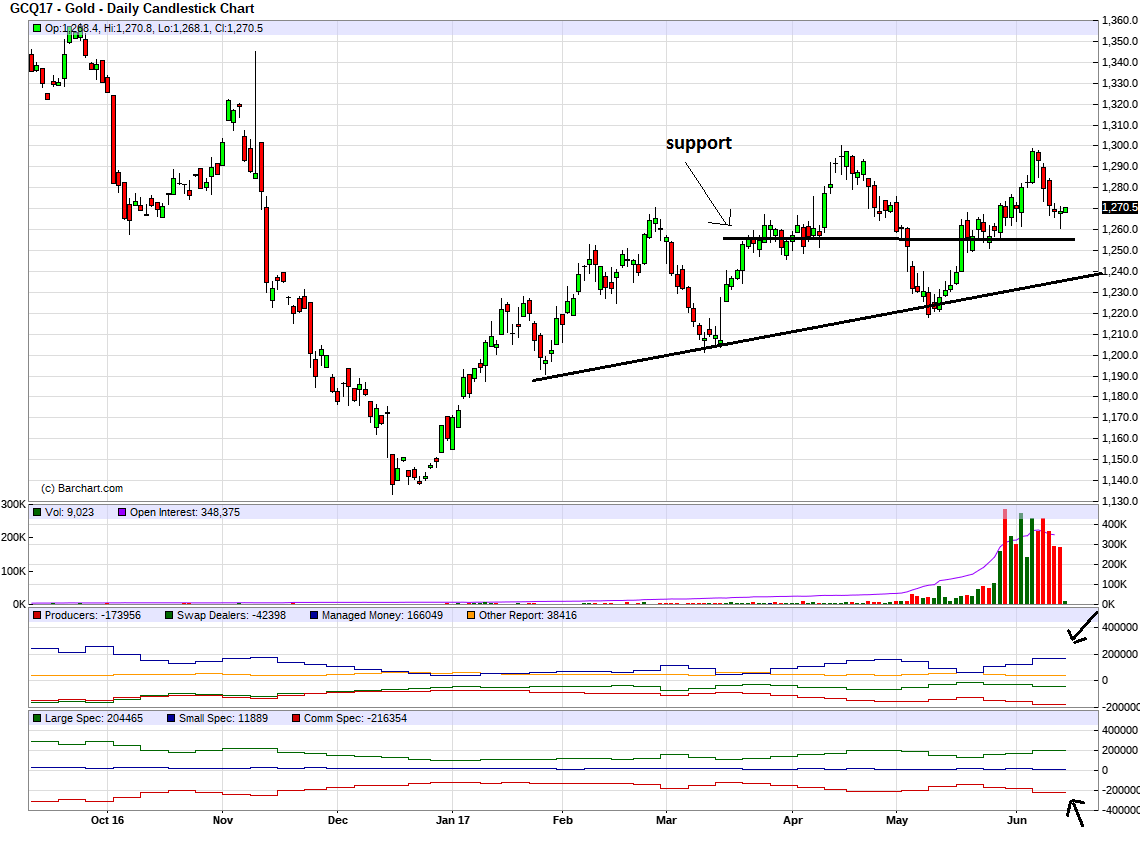
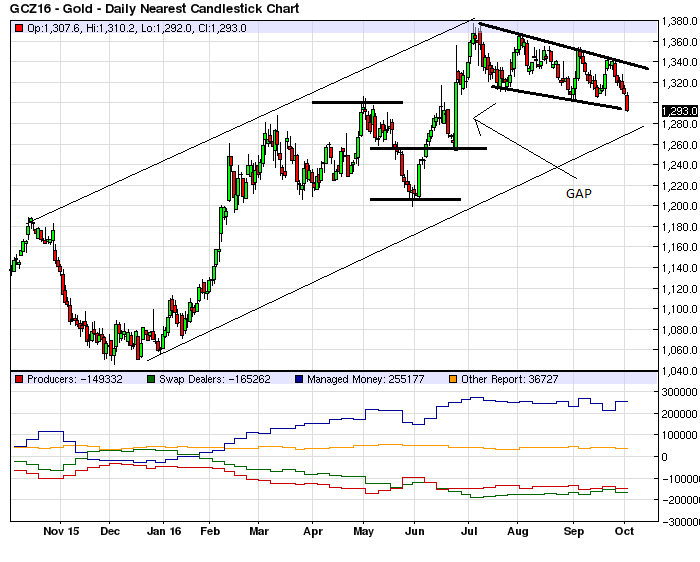
Markets are getting tougher and manipulation seems to keep getting worse. It is so bad it has become very evident in the gold market. The manipulation seems to occur for the Bank of England settlements and Comex option expiry near month end. It does not matter on the exact dates and prices. Just look at this pattern every month. After a rally, gold always corrects down and bottoms near the end of the month and/or beginning of the next month. Look at the red lines, the down cycles. We are are at or close to another bottom.
April, 21, 2022
Comstock has gone on quite the run and we are up over 100%. it looks like the stock might now consolidate these gains, so selling 1/3 positions is a good idea. I suggested the January 2023 $7 Call, it is now $11.00, so we have over a 300% gain. I would sell half these calls and ride the rest longer.
April 18, 2022
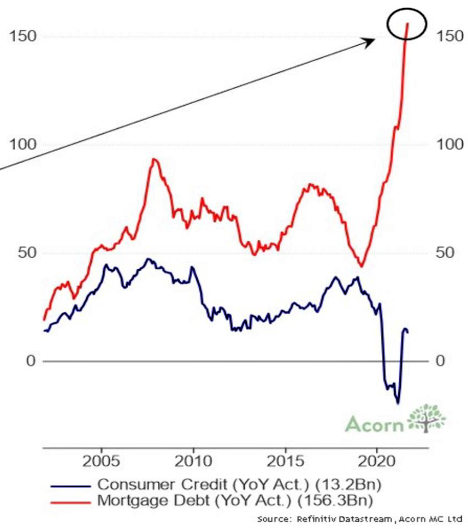
When lock downs hit in 2020 and Canada went into recession, consumers reduced their credit which is normal in a recession. Also some of the Covid relief payments went to paying off credit cards. However mortgage debt went the exact opposite way and ballooned higher, taking advantage of ultra low interest rates. This housing bubble was created by government Covid-19 policies.
April 15, 2022
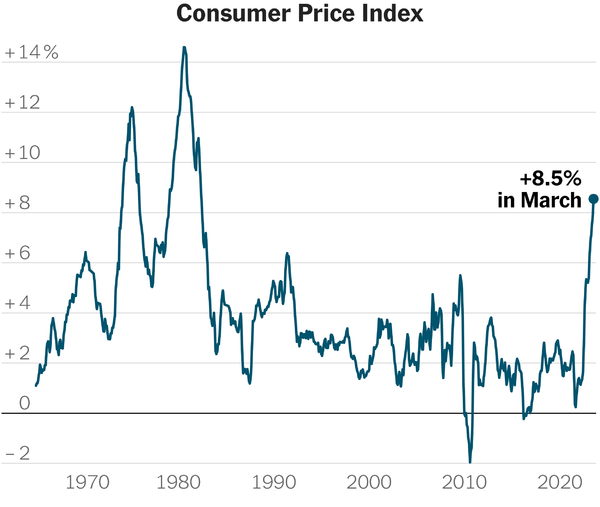
The last US inflation figure came in at 8.5% and the 10 year US treasury just gone over 2.7%, which means rates are still negative by -6%. Today, at current inflation rates, the interest rate would have to be real by at least 2% to slow inflation. That means 10.5% interest rates to slow inflation. Rates will not even get to 3% or 4% before the economy blows up.
April 7 2022
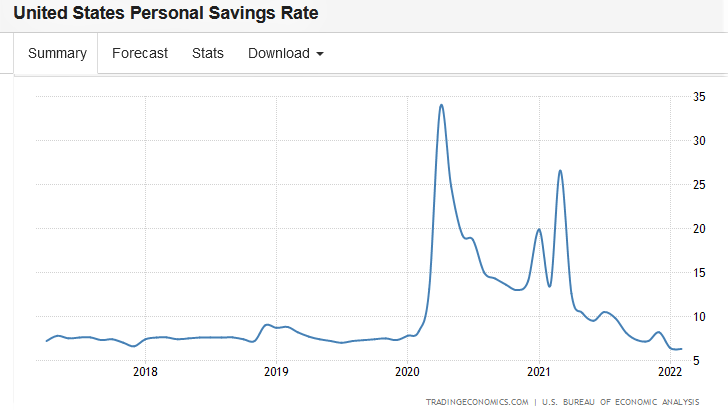
All the Covid-19 stimulus has been lost and squandered. The savings rate is at the lowest level in 5 years.Some was spent just to survive and probably most lost in stock and crypto markets. The average size of a Robinhood account is a good indication. The average size in January 2021 was $7649.
Robinhood average account size vs competitors
| Robinhood | $3,500 |
| E-Trade | $100,000 |
| TD Ameritrade | $110,000 |
| Charles Schwab | $240,000 |
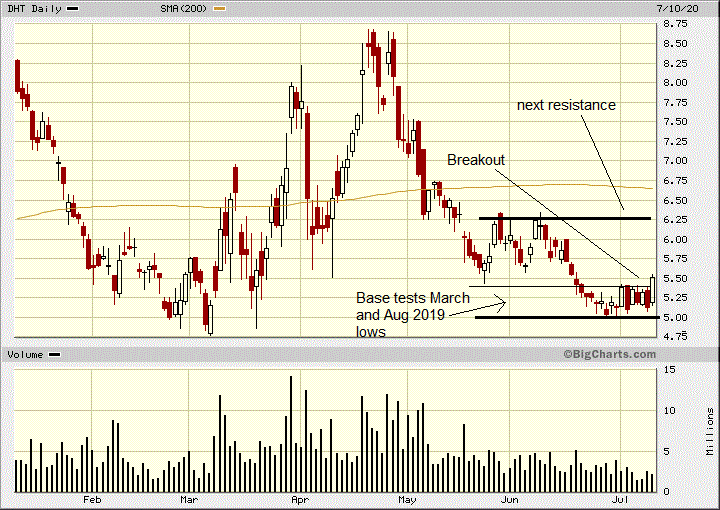
July 10, 2019
DHT Holdings was beaten down for no good reason other than a knock down by shorts. Last short report shows 14.1 million shorts which is 12.2% of the float. The dividend yield is 13.4% and oil storage rates continue at verh hig rates. Right now this company is a cash cow. On the chart a nice base was built between $5 amd $5.40 which also tested the March and August 2019 lows, a triple bottom. It is now breaking out of that base for it's next bullish phase. If shorts have to cover, the rally could be large and fast. Shorts will not want to stick around and pay the August dividend.
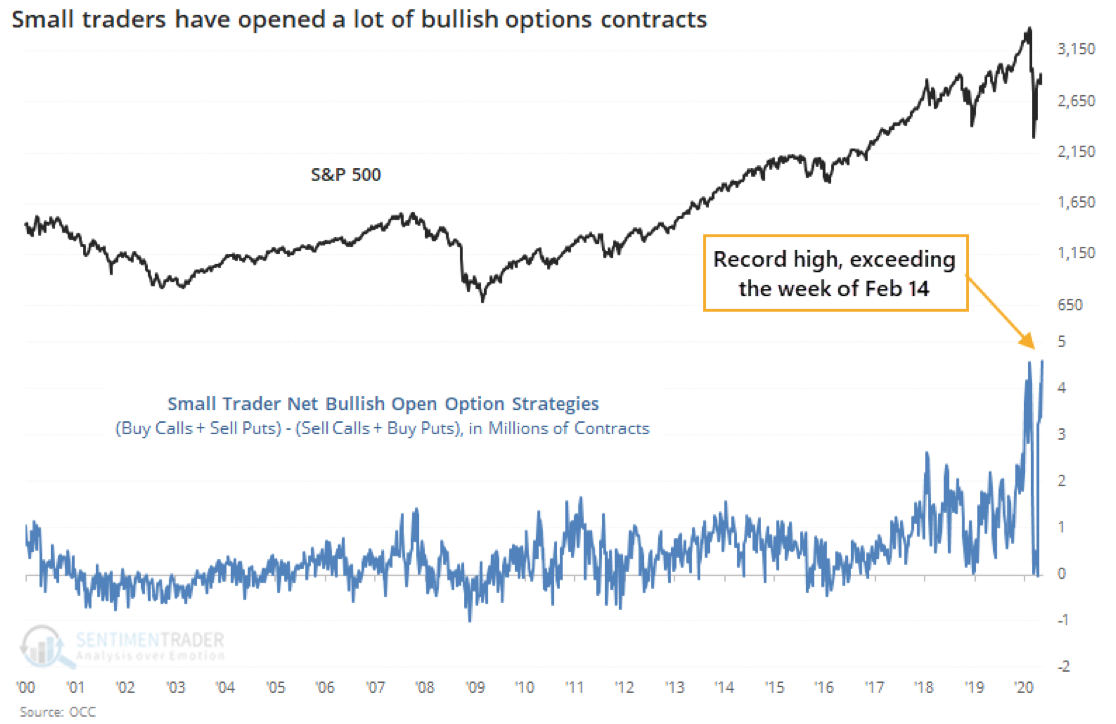
May 19, 2020
This is a very bearish signal, when small investors bet heavily on bullish moves in the markets by buying Call Options. The prior record was February 14, about the peak of the bull market.
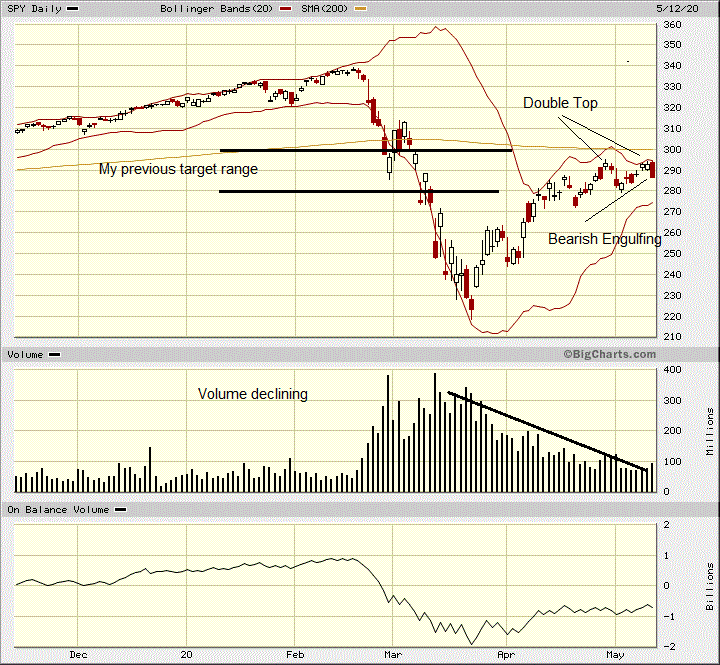
May, 13, 2020
I looked at 30 or so charts of popular stocks and ETFs after close Tuesday and they all showed mostly similar patterns. As an example I am using the Spyder ETF (SPY) chart to highlight this. Note the declining volume, back to pre panic levels, this is not a positive indicator for the rally to continue. Other negative or topping indicators include:
-
Bollinger Bands are tightening, often a signal of a market move (up or down);
-
OBV remains negative, there has mostly been selling into this rally;
-
The market has climbed into my target range;
-
We can see a double top on the chart;
-
Bearish engulfing on Tuesday (a dark candle engulfs the previous white one).
May 11, 2020
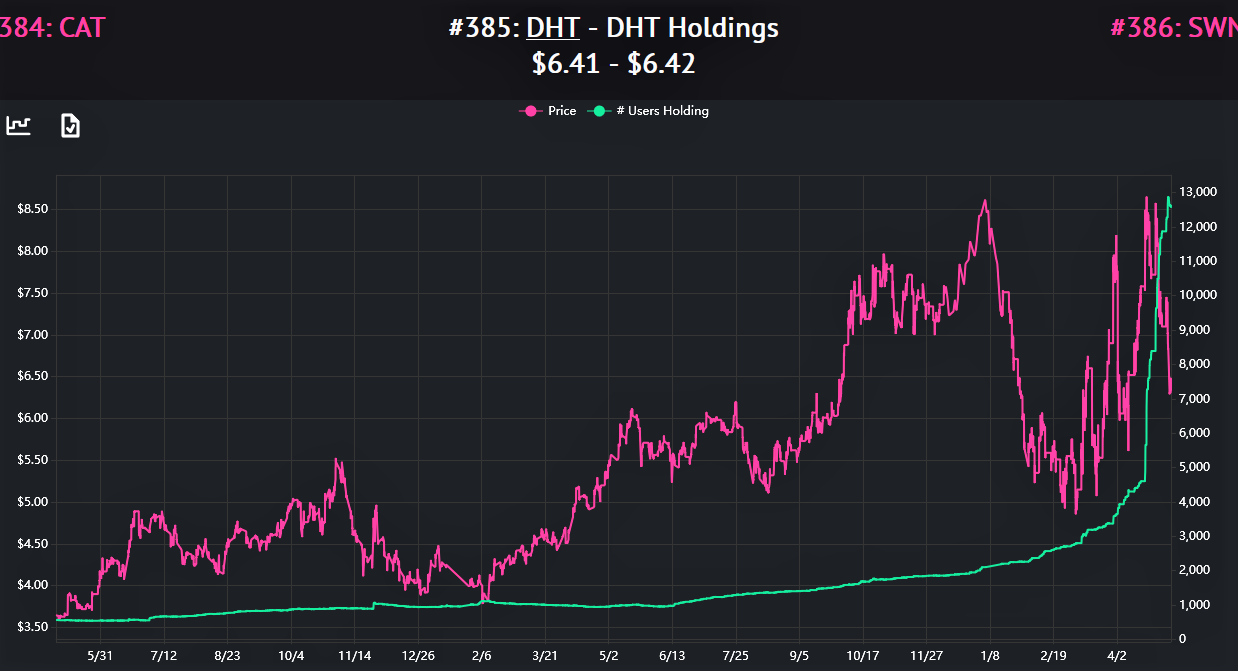
Retail investment interest soaring at Robinhood. This chart of DHT Holdings, a stock I featured a month ago or so. I am surprised to see how popular it is at Robinhood. It went straight up in April. The number of users/holders jumping about four fold.
May 4, 2020 - The Great Bear Trap
I am using a chart of the Spyder ETF (1/10 of S&P 500) to highlight volume. I predicted the bear rally on March 24th and possible levels in my March 29th update, that the rally could reach, shown below as around 280 and 300. This rally has been on low volume, not a good sign and since the market has reached my upside targets, it is all down from here. I am not predicting straight down like the arrow, but eventually 120 to 140 on (SPY).
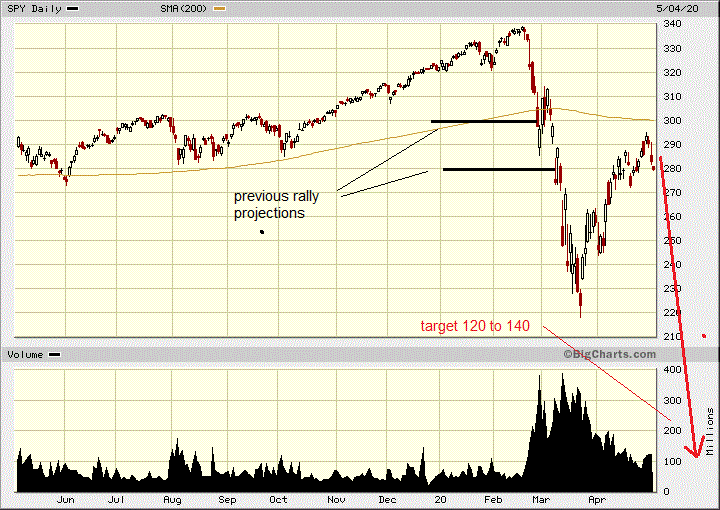
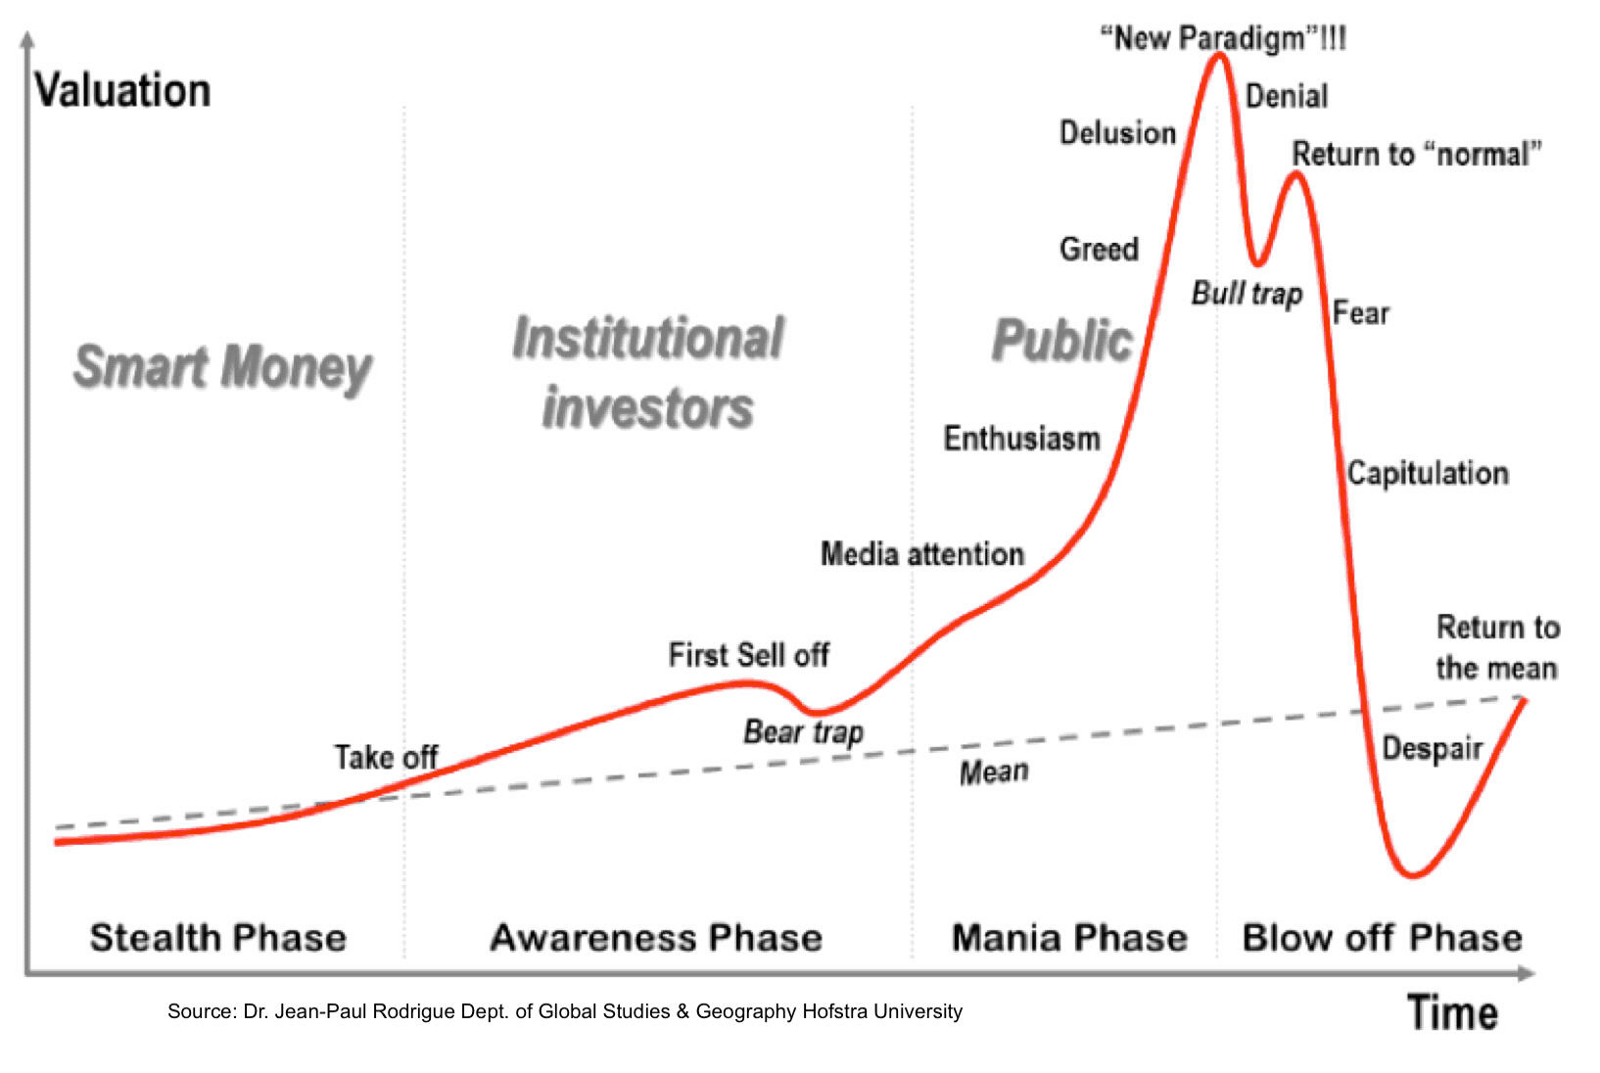
The sell off we had in February/March was anxiety about Covid19 and the economy and now the market is in denial. On the chart below, I believe we are in the denial and bull trap. Markets are hoping that as the economy is re-opened, there will be a return to normal. In fact we have not even reached the fear, capitulation and despair phase yet. That will start later this year and perhaps despair sometime in 2021.
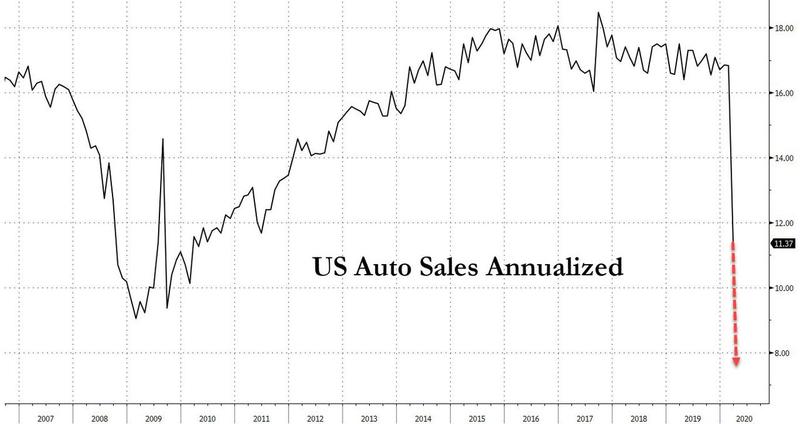
April is slated to be the worst month on record for U.S. auto sales.
Edmunds forecasts that just 633,260 new cars and trucks will be sold in the U.S. for an estimated seasonally adjusted annual rate (SAAR) of 7.7 million. This reflects a 52.5% decrease in sales from April 2019, and a 36.6% decrease from March 2020.
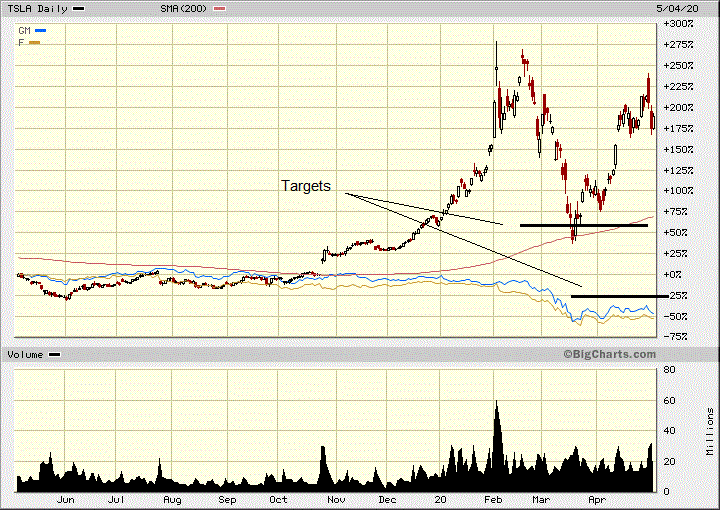
To look at market examples today, Tesla (TSLA) and US Oil Fund (USO) show the 'V' recovery mentality or more accurately the hope and denial bear market rally.
Tesla has always been a popular retail stock and in this chart, I compare it to Ford (F) and General Motors (GM). For some reason that I can only describe as hope and denial, investors think Tesla will be immune to this recession. Auto sales are plummeting but for some reason, those that buy Tesla cars will be immune to Covid19 and the economic recession. Again, hope or denial, or both. My downside targets on Tesla are marked on the chart and on a price chart, they would equate to $400 and then around $200.
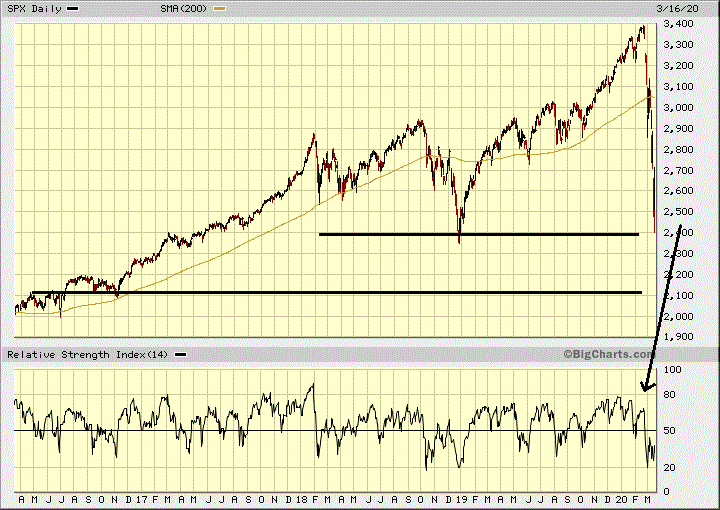
March 24, 2020
We could see a bear market rally, it does not make sense with the fundamentals, but perhaps the Fed has pumped enough QE in for ample liquidity to ease the selling. Markets and gold soaring the same day is proof of that. The DOW was up over 2,000 and gold $100.The DOW and S&P show morning star reversal patterns and the Nasdaq Composite a morning doji star reversal. I will show the S&P 500 in this chart. A morning star starts with a down day, red candle on Friday, agap away from that red candle (Monday) followed by a gap up and white candle today. These are strong reversal patterns and could only mean a rally for a few days, but could be longer. My next target on the S&P was around 2100, maybe Monday was close enough? Never the less it is a rally that should be sold into.
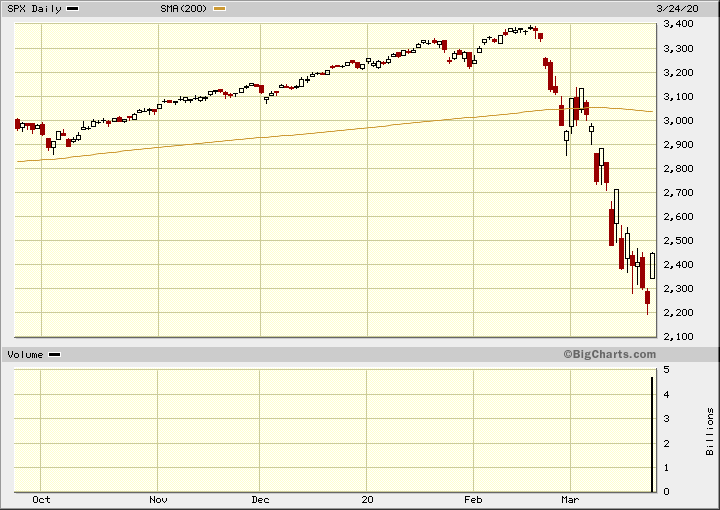
March 16 2020
Today the S&P hit my next down side target around 2400 and we are surely going to my next downward target around 2100. After that the market will head down to the 1200 area and could be the potential bottom. Yes a -60% to -70% decline. This will be the worst bear market in history
March 12, 2020
Gold will react similiar to the 2008 crash and will correct as investors/funds scramble for cash out of panic and margin calls. A drop somewhere between $1350 abd $1550 before a reversal.
Gold will rebound and go way above $2,000 because this next trend on Fed balance sheet (QE) will go off the charts
March 8, 2020
I have been calling the interest rate decline, a race to zero for a long time and now I believe this race is in over drive. My next target for the S&P is just above 2,700. Official bear status is a drop below 2714 and I expect the plunge protection team will make a valiant stand there. Lets see if they can hold it. I have my doubts.
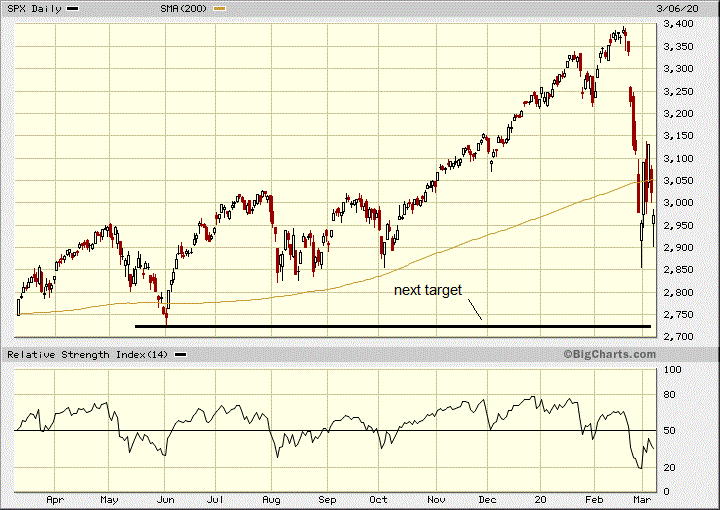
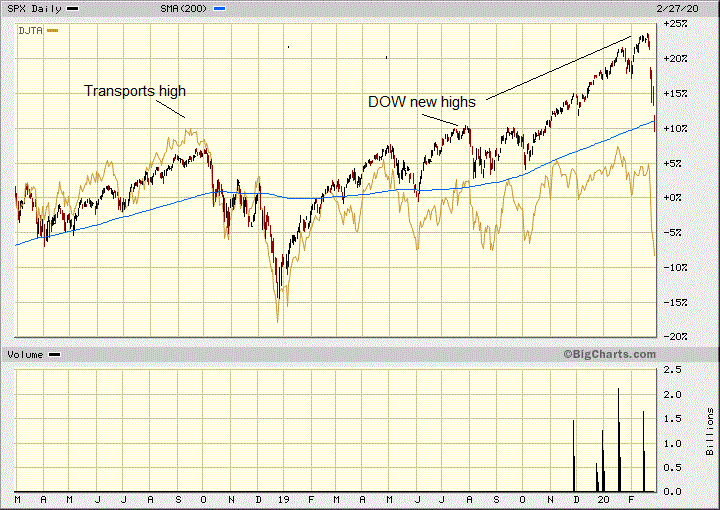
February 27, 2020
Dow Theory negative - With Dow theory, if one index rises to new highs, say the DJ Industrials, it should be confirmed by the other, DJ Transport Index. Here is a chart to compare the two. While the DOW made new highs in August last year and then from December 2019 to January 2020, it was never confirmed by the transport index whose last high was September 2018.
February 25, 2020
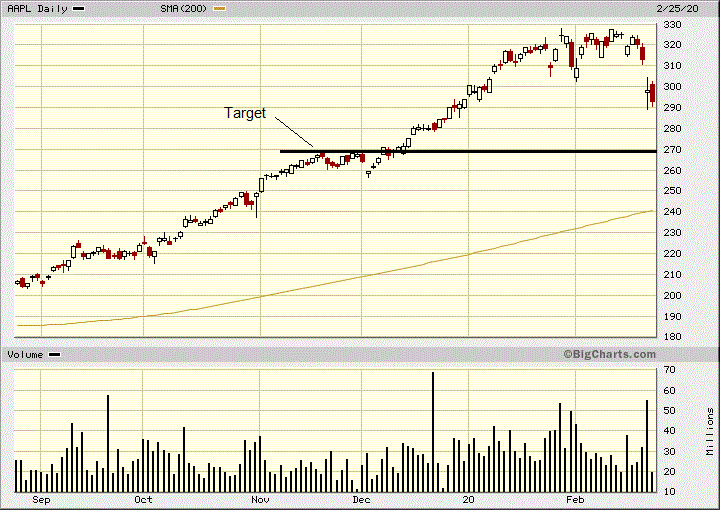
Heelo's beacons are not sourced out of China, but Apple iPhones are. The stock chart on Apple broke down yesterday and it is headed much lower.
February 12, 2020
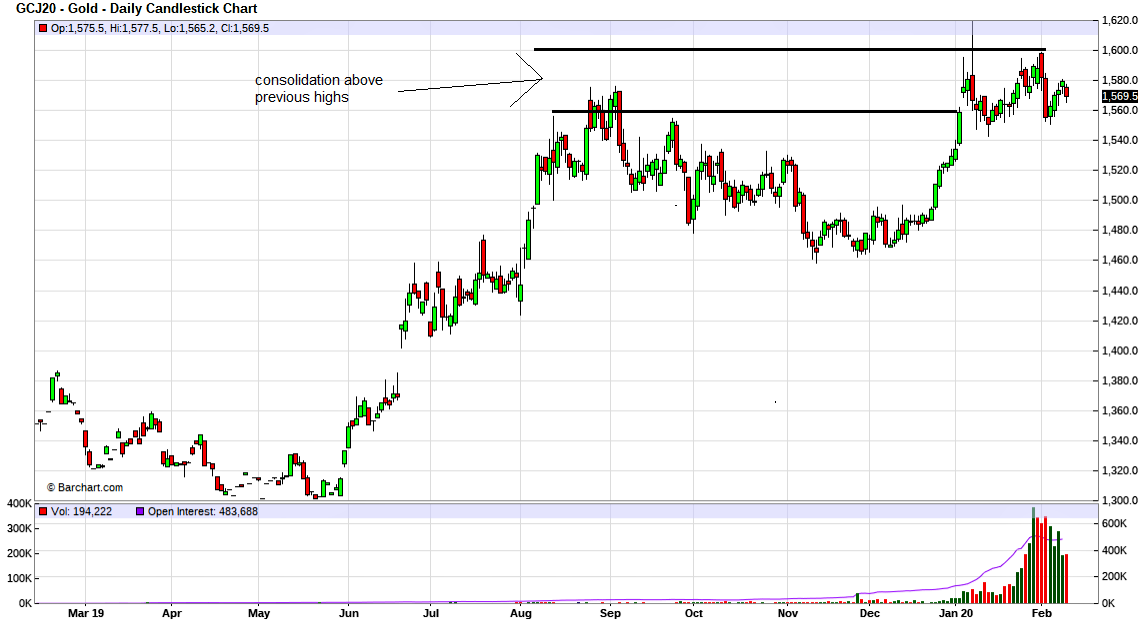
Gold is about to soar in price because of a world wide misinformation campaign. So far the effects from the corona virus are being mostly ignored by the markets. There seems to be hope that this virus will be contained or maybe it is denial of economic damage it will, and could cause. The economic impact could be catastrophic. What if markets start to price in the worse. China and the world economies were already slowing ahead of this. The US is doing the best in the world but still GDP is only around 2%. This corona virus is going to get much worse before it gets better and it is happening in an already weak economy. We are a few months away from seeing any impact, that could start showing with Q1 data.
Slowing economies will results in more QE and a quicker move to zero interest rates. US stock markets are frothy at record levels and the balloon is seeking a pin. These factors are all positive to gold and the price chart is just itching to break to the upside. I commented previously that I wanted to see a close above $1600 to confirm a break out, but lets call a spade a spade. Since gold broke higher in early January the chart looks like a consolidation above the previous high. This usually results in higher prices. Now is an excellent time to add both producers and quality junior gold companies to our portfolio.
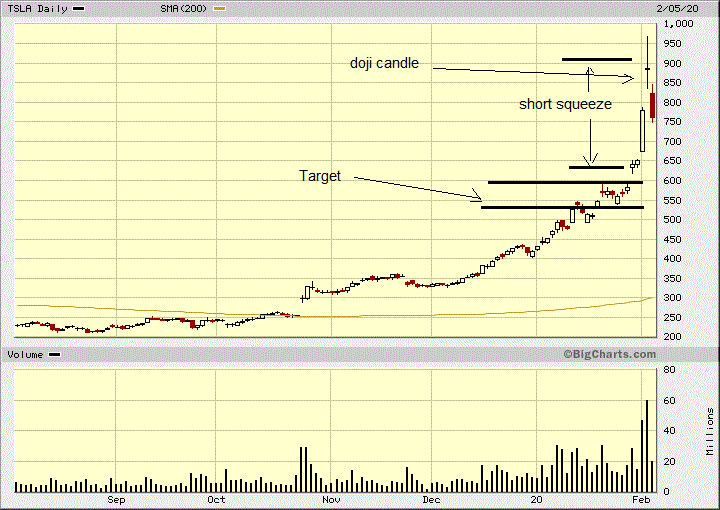
February 5 2020
I highlight the short squeeze, the doji morning star top and my downside target. Normally when a stock runs on a short squeeze, it comes back down to where the squeeze started. The short squeeze got underway in earnest on Monday and Tuesday when the stock spiked from about $640 to $960, about $320 on heavy volume of over 100 million shares.
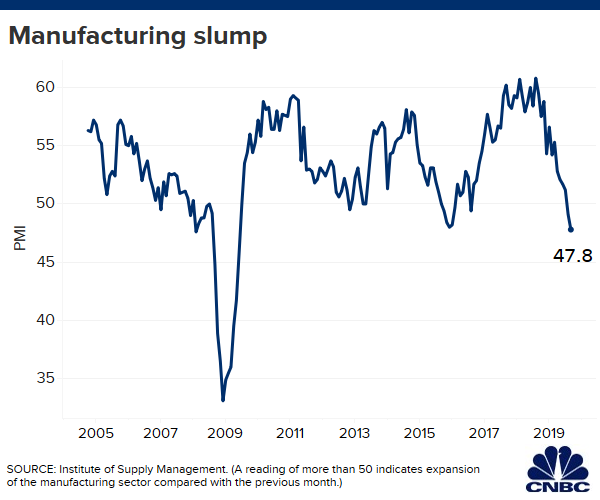
October 2, 2019
October has not started well for stock markets and that should be no surprise to readers of my newsletter. As I mentioned before, it is not popular to be negative, but I am not doing this to be popular anyway. I have been warning of an economic slow down and likely recession that would cause a big plunge in markets. Yesterday more proof arrived to support my theory. The manufacturing PMI survey hit 10 year lows, last witnessed in 2009.
Manufacturing is no doubt being effected by the trade war.
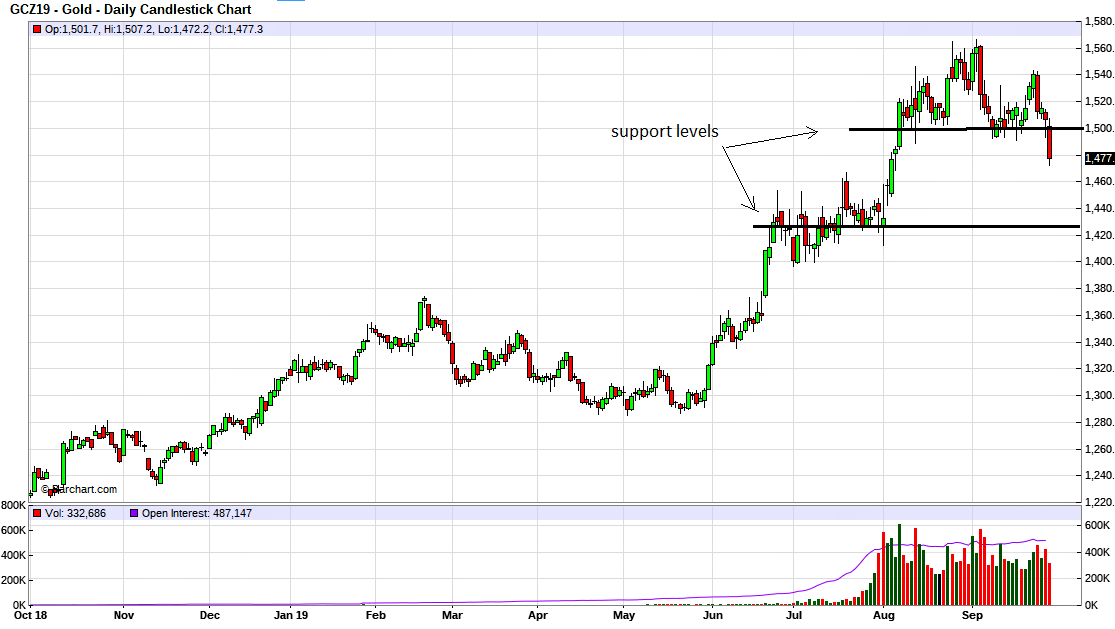
September 30. 2019
I commented that gold had technically made it to the bottom of my resistance level at the $1,600 target. A consolidation and correction is normal and we could see further downside. My two support levels were $1,500 area that was breached today and next support is around $1425 area. I expect gold could weaken further to this level. This will provide a good buying opportunity and I plan on added a few more golds stocks with this correction.
September 29, 2019
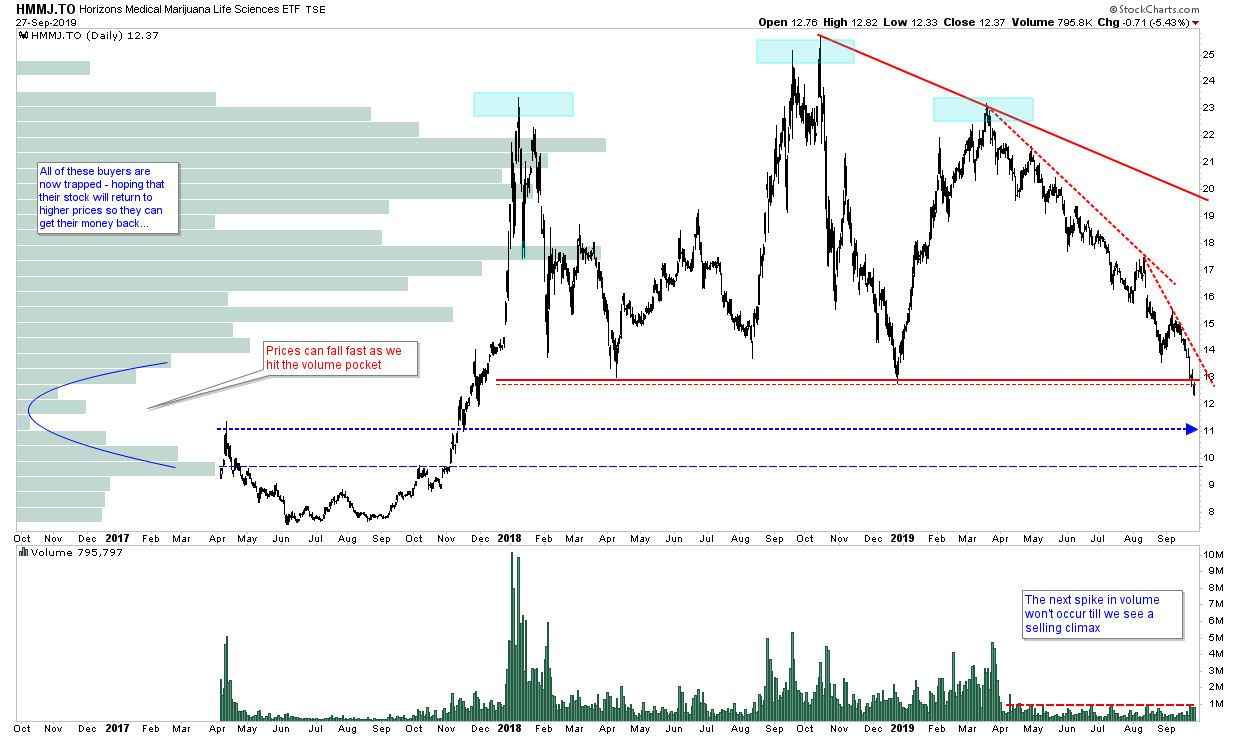
This chart of the Horizon marijuana etf, makes some good points. The etf has made a new low, a technical break down. Most of the volume in this and all marijuana stocks was at higher prices. These are now trapped investors clinging to emotion, which is hope their stocks recover so they can get their money back. They should sell now and take a smaller loss as to what is coming. There has been no volume surge and it will probably happen at a bottom, a selling climax, probably tax loss selling season that will hit these Pot stocks hard. Further evidence with the pocket volume shown in red on the left.
September 16, 2019
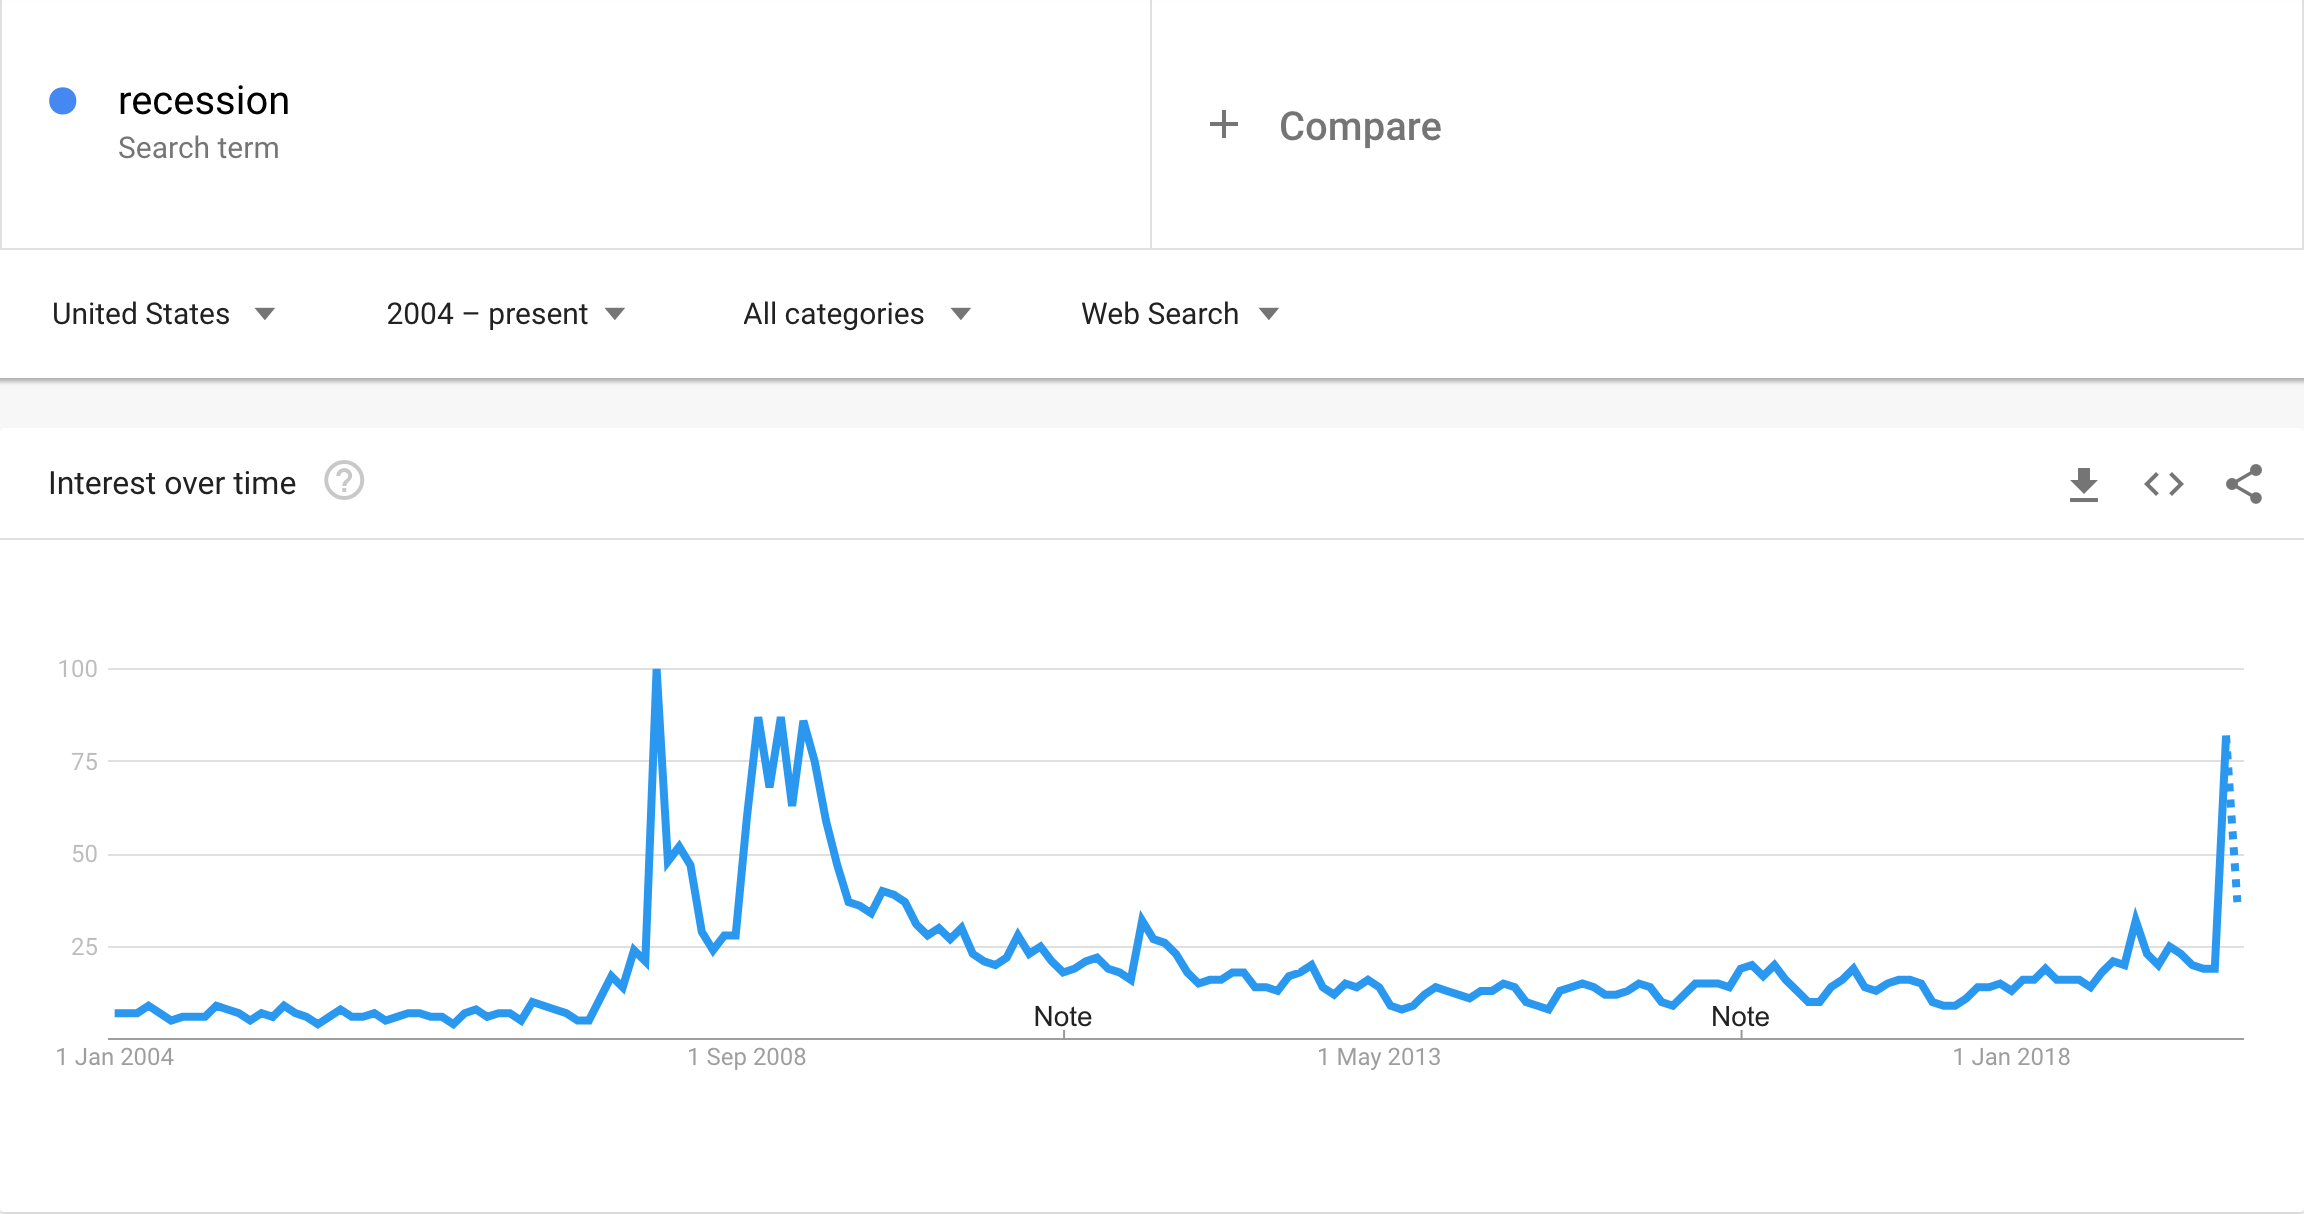
Interesting that google search on recession has taken a jump, just like before the 2008 one hit.
June 25, 2019
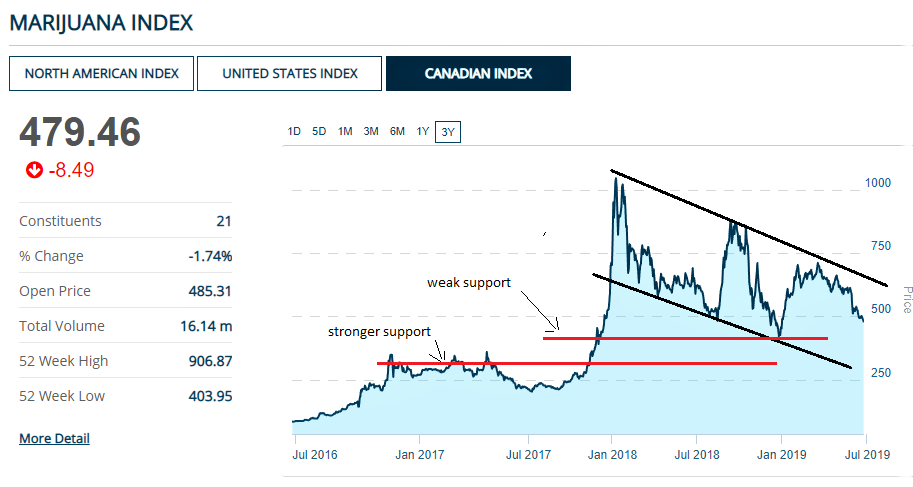
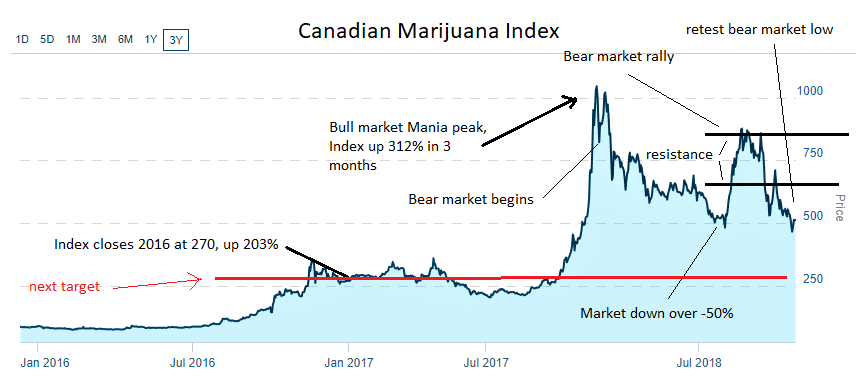
An update since my February 28th chart. As suspected the rally in the Canadian Pot index was a bear rally and retreated around my resistance level. The index is heading down again and I expect new bear market lows. There is mild support aroun 400, but is probably headed lower and the index will fall into the 300 to 400 range.
June 20, 2019
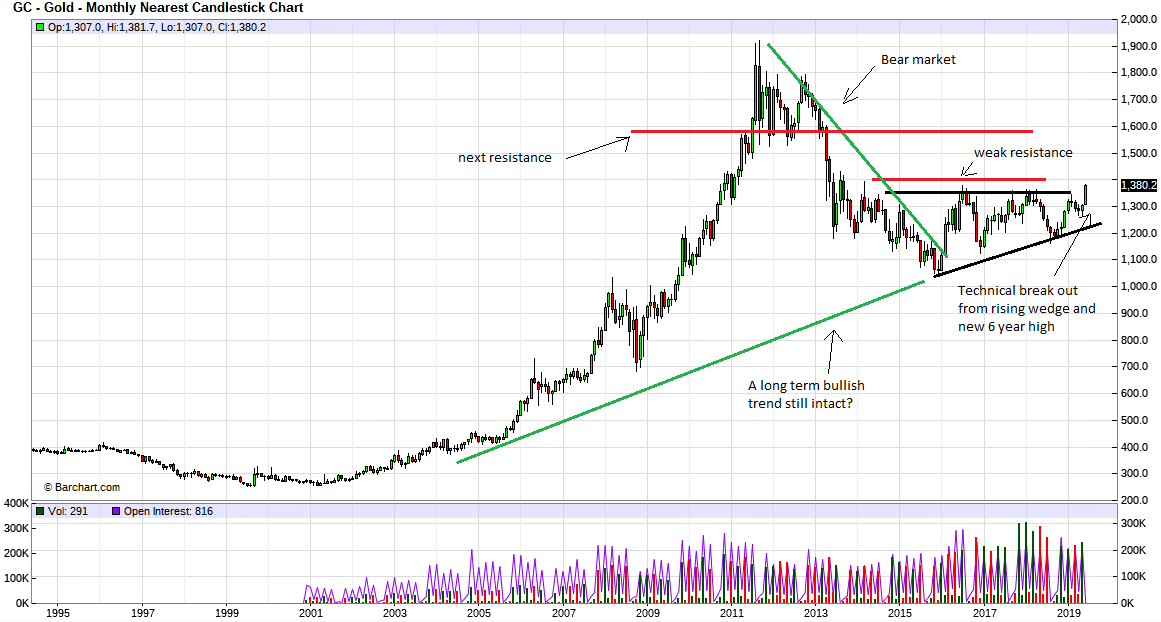
Today is the most significant day for bulls in the gold market as we got a technical break out to 6 year highs. It is the best news for gold bulls since 2011. It signals that a Fed easing cycle is on the horizon.
June 12 2019
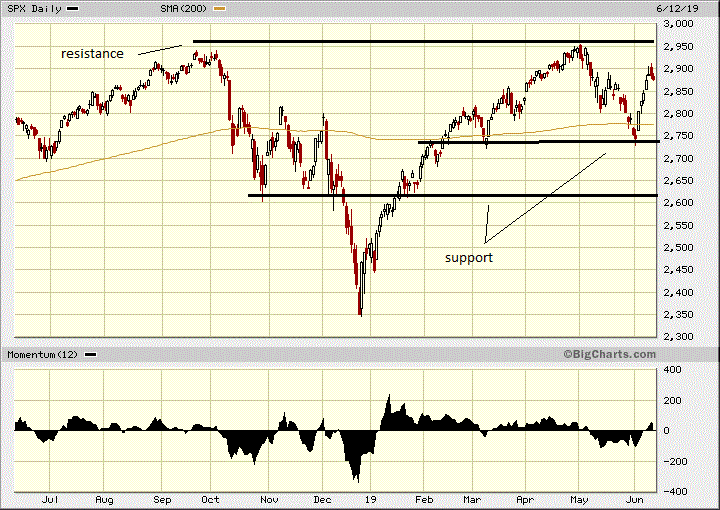
The S&P has rallied in June and I expect this is a relief rally with not much upside left in the market. I have marked what I see as the two support levels. I believe the market could be range bound with recession and trade fears limiting the upside and the Fed talk about cuts and easing holding up the bottom end.
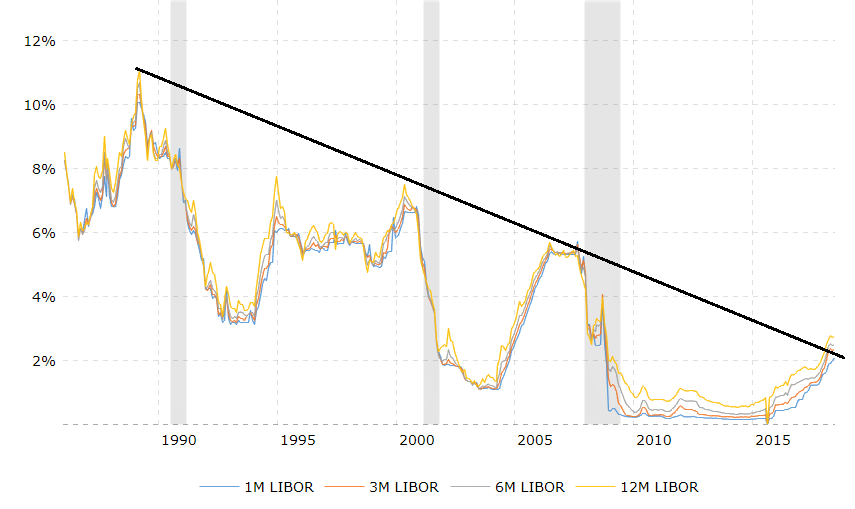
June 10 2019
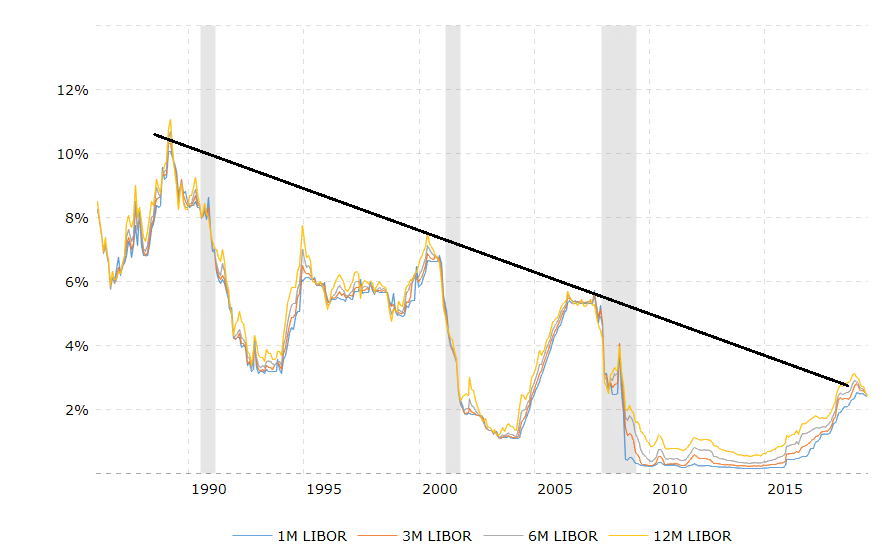
The market consensus on interest rates has completely reversed and now it is believed there will be a rate cut as early as July. This should come as no surprise as I have highlighted for some time that rates were high enough to cause a slow down or recession. Below I drag out the chart on Libor rates I have been using for the past year to predict this rate peak. The most notable change since my March update is that rates have declined some more. Again, each rate cycle peak is lower because ever rising debt levels.
June 7 2019
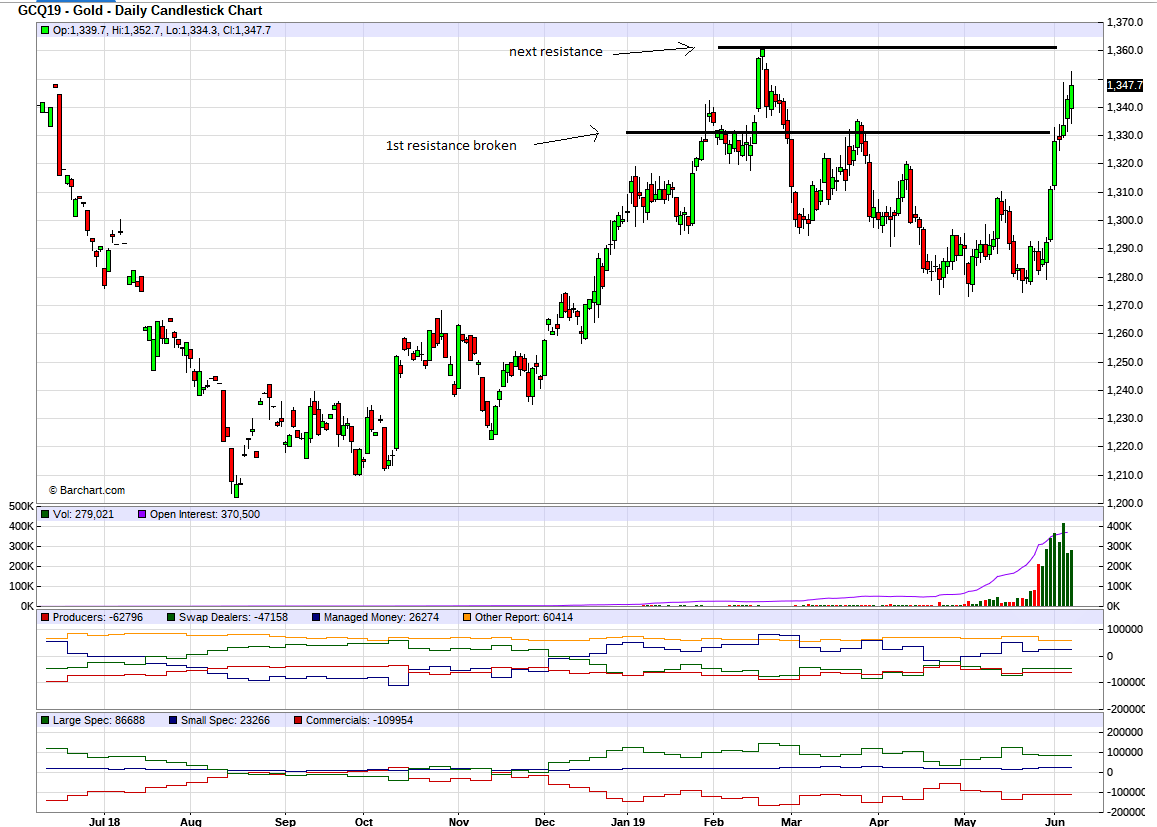
Obvious now that gold has broken through my first resistance area. Next is above $1360 which would be 5 plus year high. The major resistance is $1400, a break above that would signal much higher prices. Can anyone say 'summer rally'?
June 1, 2019
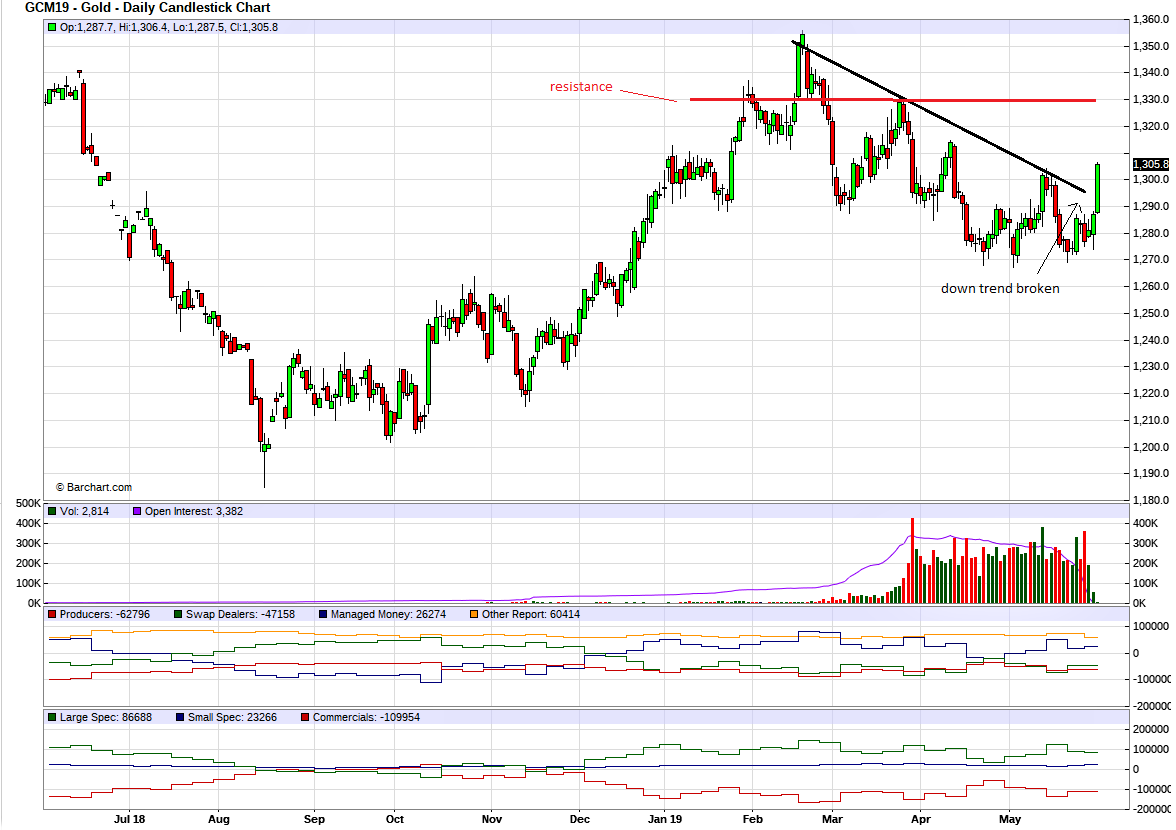
Friday also witnessed big reversals in the Gold and mining sector. On the Gold chart you can see the big up move on Friday that made a higher high. I marked resistance in at $1330 and I believe we will have to get above that for a good chance of new highs. The stars are lining up with general equities in decline, a weakening economy and an inverted yield curve. There is a strong chance the Fed will have to reverse course and cut rates later this year. That would be the match to light the fire under gold.
May 31, 2019
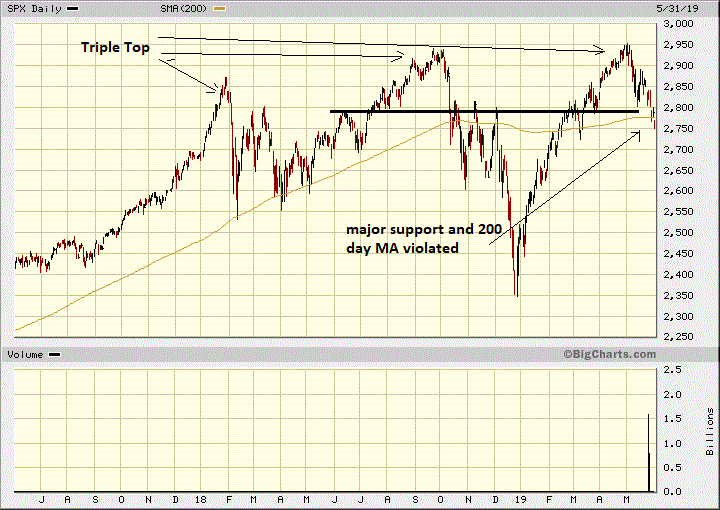
Friday was an important reversal day in the markets. The S&P fell below my support line last week and then on Friday fell below the 200 day MA. The market also shows a triple top pattern that is even more pronounced on a chart of the DOW. Triple tops are seldom over come.
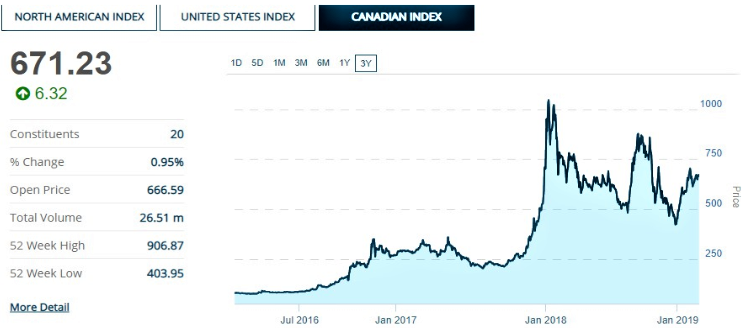
Feb 28, 2019
The Canadian Marijuana index is still in bear status. Near term resistance is around 700. It looks like just another bear rally. In contrast the U.S. index broke to new highs in October, came down in the correction and looks like it could test recent highs. I believe the Canadian government botching the legalization process is the big difference. There simply is no or a very poor retail market in Canada, still waiting on the first stores in the largest market Ontario. Retail in the States that have legalized is far superior.
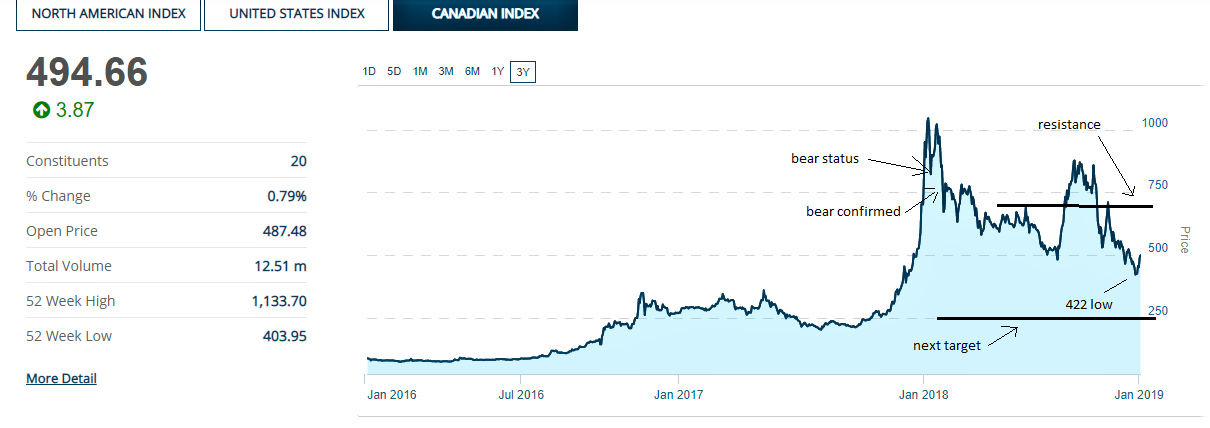
January 4, 2019
The marijuana market entered a bear market on January 12th, 2018, had a nice fake out rally and confirmed new bear market lows on February 2nd. At least we had a nice bear market rally in September and October, but that too was wiped out in November and December. The index hit a new bear market low of 422 on December 21, down -60% on the year. That market hit investors the most because so many were sucked into the hype. Fortunately for us, it was about the only place we made money, taking profits out of many on our list. My next target in this market is around 250.
December 24, 2018
Put Call Ratio surpasses 2008.....if this doesn't indicate panic, I don't know what does.

December 18, 2018
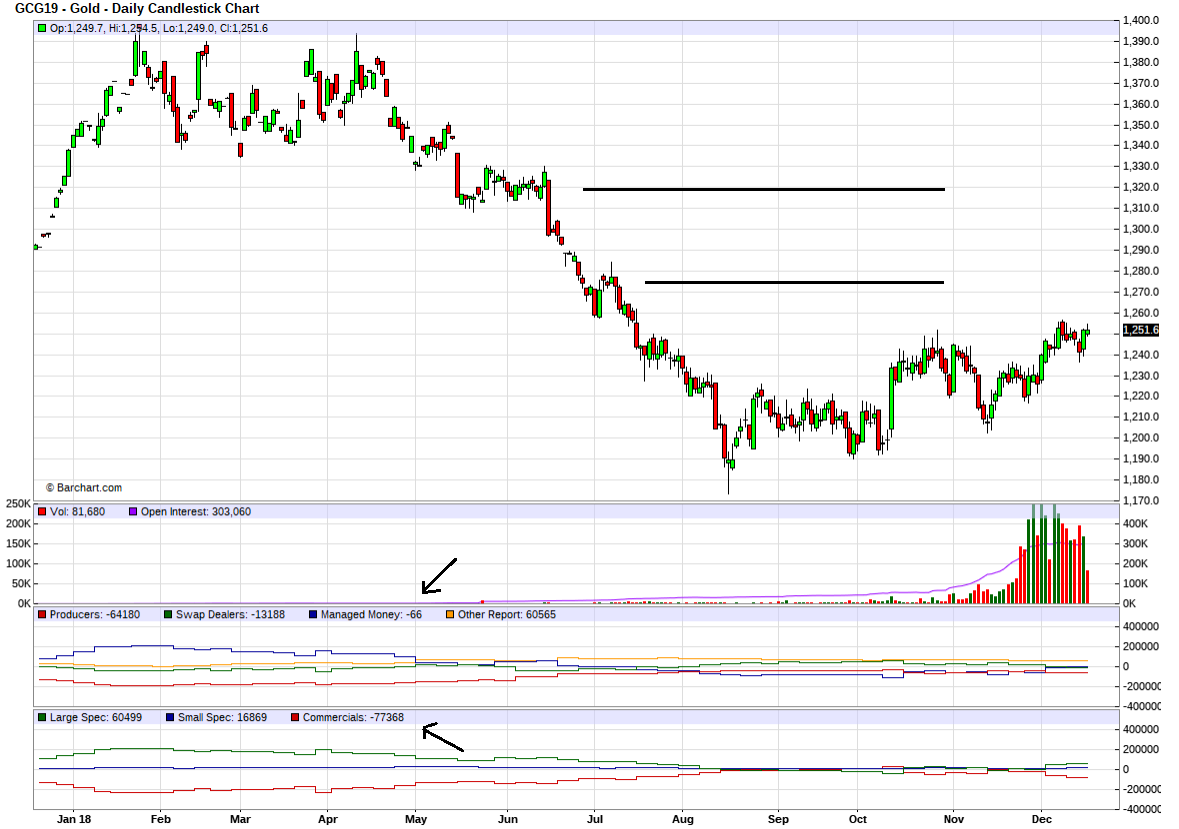
Gold is acting as I suspected as it often moves counter to general equities. Managed money has also started covering shorts as expected, helping to drive this rally. Since my December 5th update, they have covered about 58,000 short contracts. I expect managed money will go net long a considerable amount. Next resistance levels are weak resistance around $1270 and more at $1320 area.
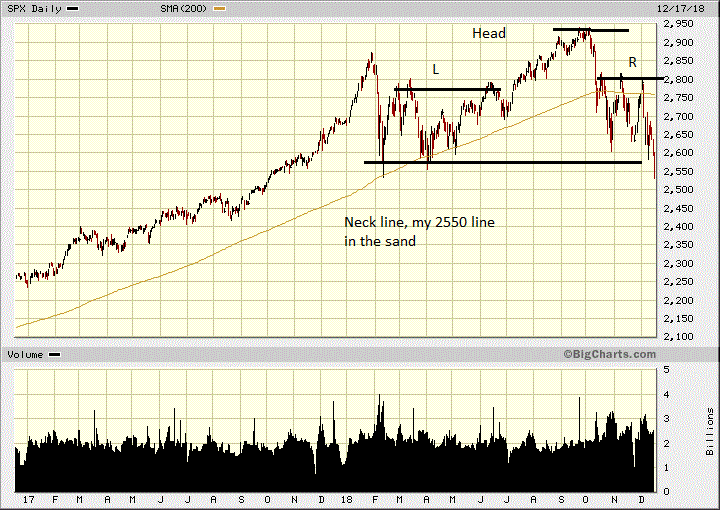
December 17, 2018
More bad news for the markets today as the head and shoulders topping pattern is now complete. It looks like my line in the sand, also considered the neck line on this pattern was broken yesterday. I have noted this 2575, 2550 area many times in the last several months and the S&P closed at 2546 yesterday. We could have a relief rally, but technically the market is broken and much lower prices are in the future. I will say again, any rallies should be used to lighten positions in general equities and funds.
December 11, 2018
I pointed out the mania peak in January and the Index recently tested the bear market low near 485. Bear markets often wipe out the mania or frivolous gains, hence the next target near 250. That said the market could rally towards resistance levels before retreating lower. If it does and comes back and makes a triple bottom, I might change my tune.
December 10, 2018
On Friday Gold made a solid break higher, above the $1240 area that I was watching. This is a solid signal that the price is going much higher. A new uptrend is clearly in place since the August bottom. The $1270 and $1320 areas are the next resistance level. The $1240 are should act as support on the down side. Gold stocks, as measure by the HUI have not confirmed the break out yet as they are testing the October highs and have not broken above.
December 5, 2018
The news is much better with Gold as we once again came close to breaking above the $1240 area that I am watching. I believe that is where short covering will trigger a more significant rally. We are still in the typical year end weakness, but some years the bottom is in November. Since we did not break above $1230 in the November rally, I was expecting the next move to be down. The fact that we rallied instead, improves the odds that November is the year end bottom.
December 4, 2018
Bad news for general equity markets yesterday. Not only was it a big down day but a reversal from the 3rd test of the 2800 resistance area on the S&P. What is more, it was a strong bearish reversal, an evening doji star reversal. Like the morning doji star is a strong bullish reversal, this is a strong bearish reversal. We are also at the 2700 support level. The market could bounce higher after such a bad day, like the old 'dead cat bounce' and a bounce higher is best case scenario.
It looks more like we could test the lows around 2600 and if the market falls through that, the odds of a bear market become very high. Official bear status would be a drop to around 2340.The evening doji star reversal is shown by the up day on Friday (white candle), the doji on Monday that represents indecision and the red candle today confirming indecision turned bearish.
Nov 22, 2018
I usually use a chart of the S&P 500 (SPY), but the NASDAQ Index or etf (QQQ) paints perhaps a clearer picture. The drop to Tuesday's low was about -16% from the high so not official bear status. However, if the index drops below my 'line in the sand' it will go lower and into an official bear market. The 200 day MA also looks to be turning down, another long term negative. It is easier to see the potential head and shoulders top I have been commenting on, looking at the NASDAQ compared to S&P 500.
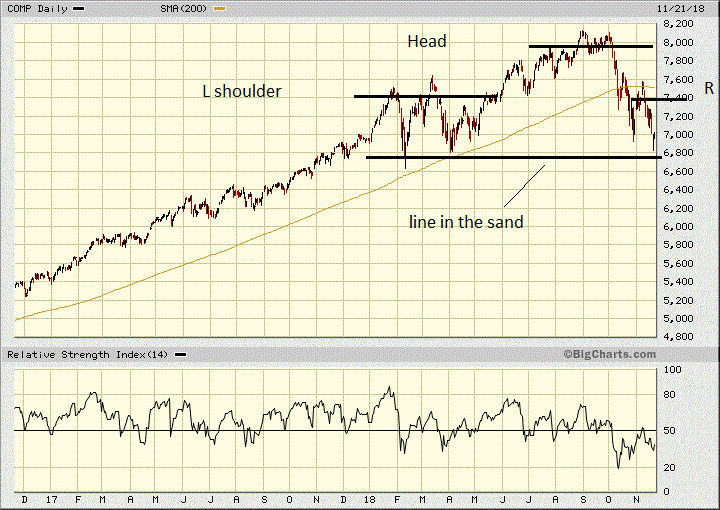
Nov 21, 2018
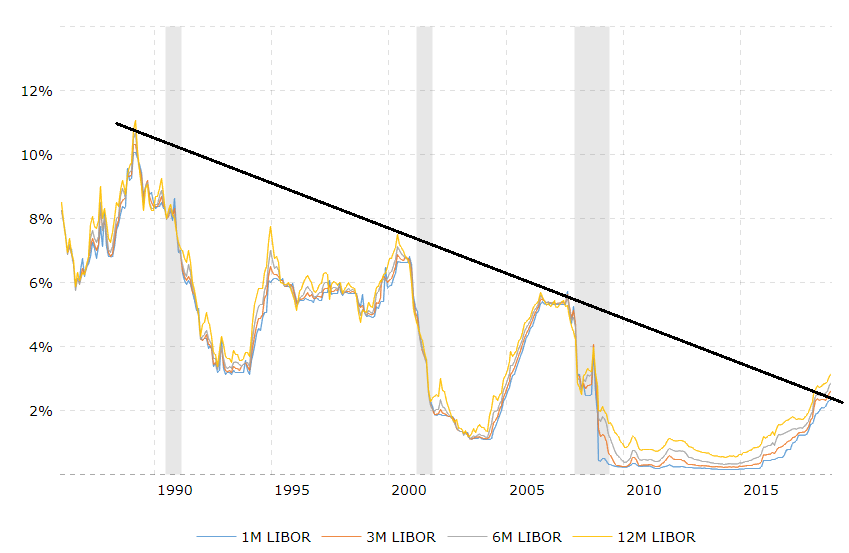
Nearing the end of the rising interest rate cycle is no surprise. I have been using this chart on Libor rates for the past year or so. It reveals that each interest rate cycle does not have to go as high to trigger an economic slow down. This is chiefly because of rising debt levels in every cycle. Since my last update we have moved slightly above the trend line, so a peak in interest rates could be imminent. If the Fed relaxes, keep in mind that budget deficit pressure could still hold rates up.
November 14, 2018
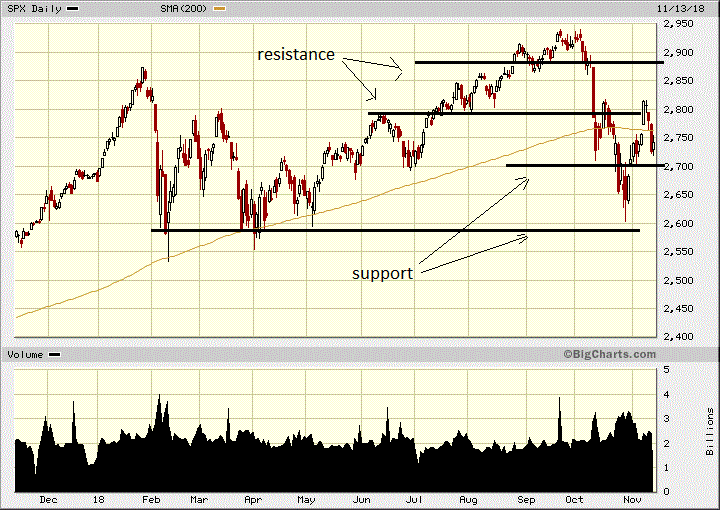
The markets certainly appear in a stage of transition or rotation with no clear direction. Or just Crap!!
The S&P 500 looks to be putting in a top and ending a long bull market. Past support areas become resistance now. We tested the resistance around 2800 and retreated and if it can break above that, the index could fill the gap up to about 2900. Support is around 2700 and then 2600. Bulls want to see a break above 2900 and to new highs while bears are watching for a break below 2700 and then 2600. The market will tell us if the top is in and I will be watching the 2900 and 2600 areas closely. I expect that we will probably chop sideways between 2700 and 2900 for some time.
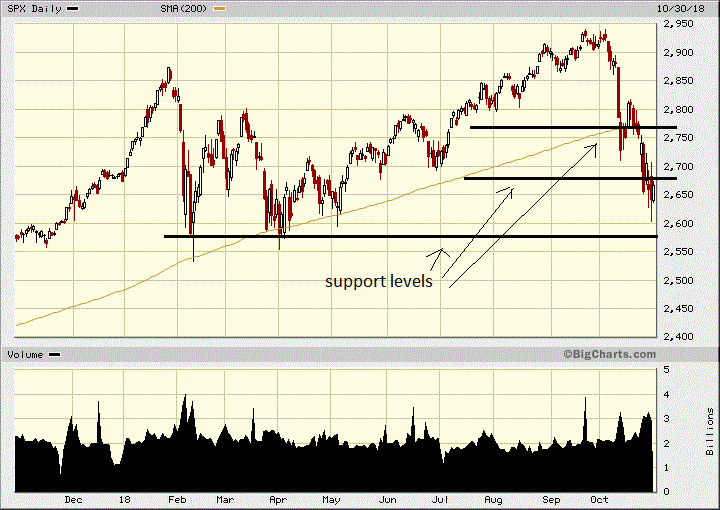
October 30, 2018
The S&P 500 has corrected about -11% from it's peak and has now tested what I see as the final support level. Notice my higher support levels did not hold very long at all. The drop to 2600 yesterday can be considered close enough to my final support as a test of that level. This recent sell off was on higher volume so another sign of a potential bottom. However, don't rule out further weakness. I mentioned previously, that if we fall below 2575, the market will go much lower. I don't believe we are headed to a bear market yet, but are probably putting in a topping formation to mark the end of the bull market. It looks like markets could be setting up a head and shoulders top and we now need to see the right shoulder form. This means a rally below previous highs and some sideways trading.
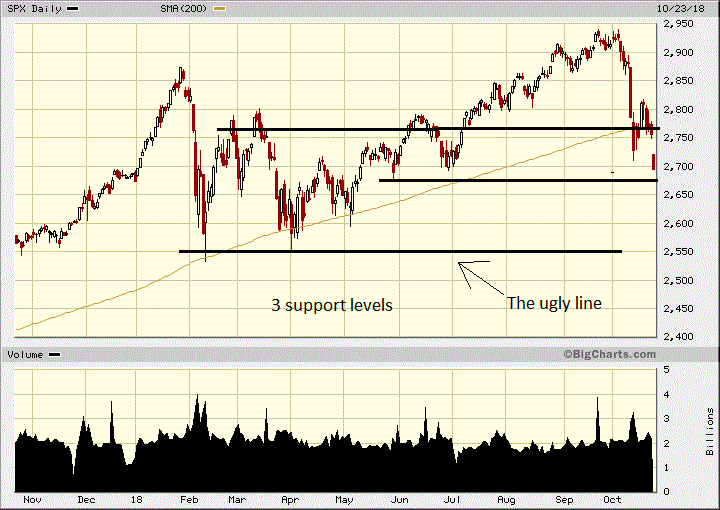
October 23, 2018
Things that go bump in the night. In September, I warned about October as the scariest month for the
stock market and it is holding true to form. I have talked about the interest rate bogyman, equity markets
topping and Gold going higher. In my last update about the marijuana legal date, I was commenting the first
major consolidation was around the corner. I admit I did not expect it this quickly. None of the recent market
action should surprise anyone following these reports.
This is all good news, you can call it market rotation and while it will harm some stock sectors like the over
valued tech and marijuana, it will be good for more defensive type stocks and those that benefit from more
inflation, the commodity sector. We are going to see much better conditions in the mining market.
Gold has jumped up where shorts will now be squeezed and the senior gold companies are moving up.
Once the market calms down some and senior miners gain more ground, the juniors will start to follow.
October is a big wake up call for those not diversified into more inflation sensitive sectors like
commodities/gold. It was not good news when the S&P quickly fell through the 2775 support area, but it did try to consolidate. I
see next support around 2675 that will likely get tested. A fall below 2550, a bear is around the corner.
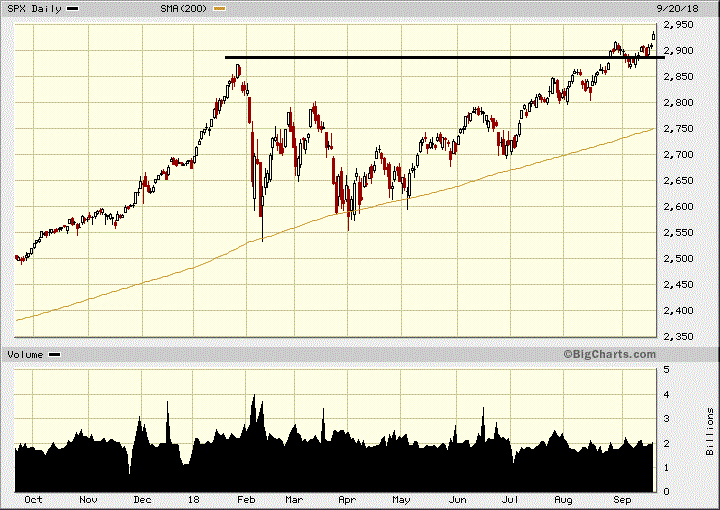
September 21, 2018
Some market observations and miscellaneous updates. I last commented that the jury was still out
with the S&P 500, but with action yesterday, I am concluding a new break out and the bull market will
continue. The S&P 500 is now about 60 points above the January high or another 2%. That said, a
significant correction is over due, watch out in October.
August 24, 2018
I have been commenting for the past month or so that the COT report has been bullish and I think the final wash out we seen in Gold last week and the most bullish COT report I remember seeing marks the bottom. There are other signals as well. Note the hammer candlestick down to a low of $1167 on August 16th. This also helped form a morning star doji reversal pattern. In Past bottoms, managed money usually had a small long position, but this time they actually have a significant short position at -83,324 contracts. They have a larger short position than the commercials, something I don't believe I have ever seen. Managed money has a much larger short position than the December 2015 bottom. This is a perfect set up for the commercials to take them to the cleaners with a strong rally.
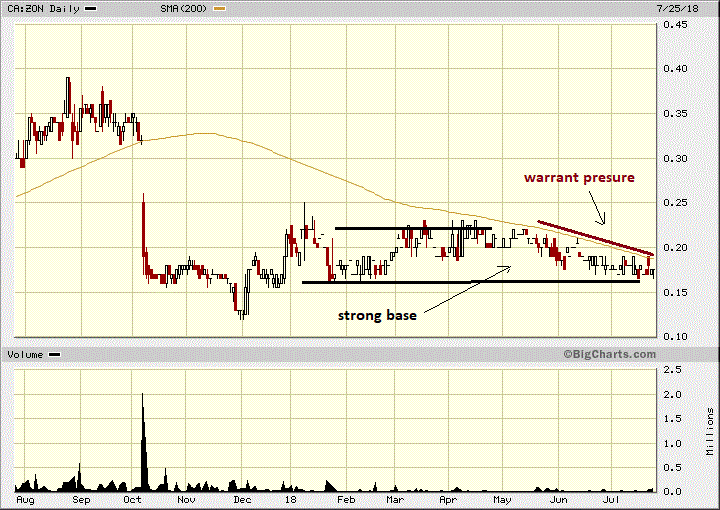
July 26, 2018
The chart looks very good for a buyer. There is a very strong base between 17 and 22 cents and we are at the bottom of that base. Warrant pressure and the market correction have moved the stock down. I believe when we break out of this base, the move to the upside will be very strong and difficult to buy. Now is the time to buy, before drilling, news flow and better markets are upon us.
July 5, 2018
Oil markets are moving to supply deficit again, driveen by continued growth in Asia
June 30, 2018
Surprising the bearish indicator is so low with just a modest correction
June 25, 2018
June 18, 2018
I was expected the index to re test 570 area as a double bottom, but with gold and silver at the bottom of their range and the summer doldrums around the corner. there will be a final washout. Sort of like a final kick to the longs while they are down. Perhaps down another 25 points or so.
June 5, 2018
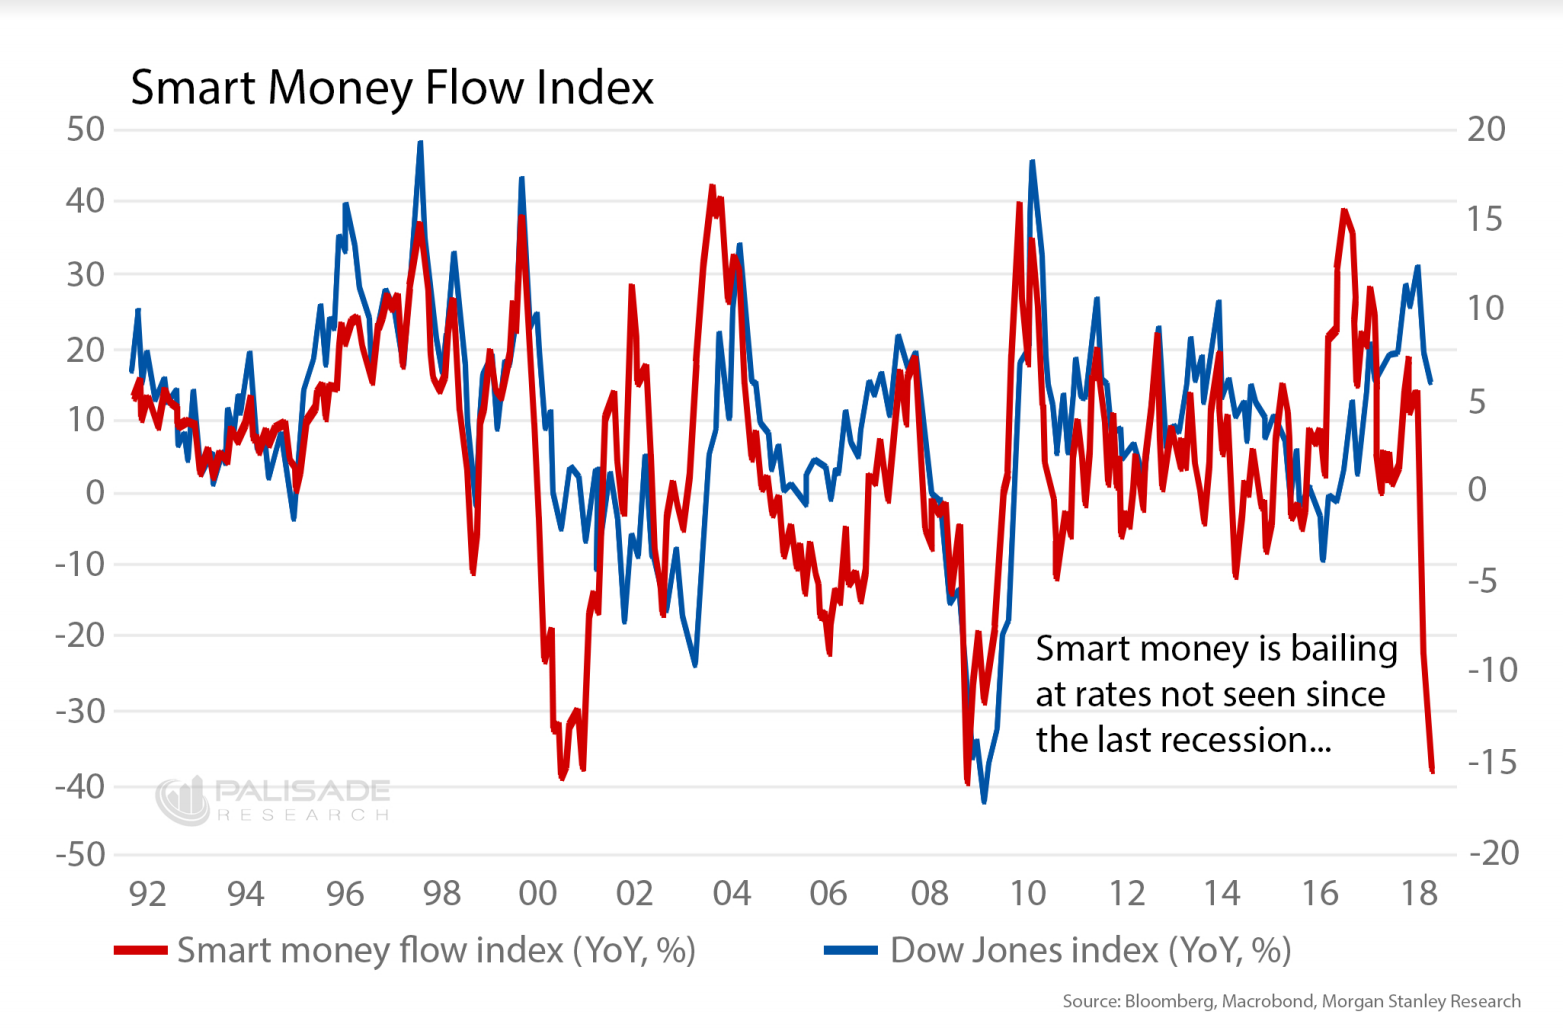
This chart from Bloomberg is quite alarming. What has this smart money alarmed? Certainly some of the items I have mentioned in my June 5th report.
May 30, 2018
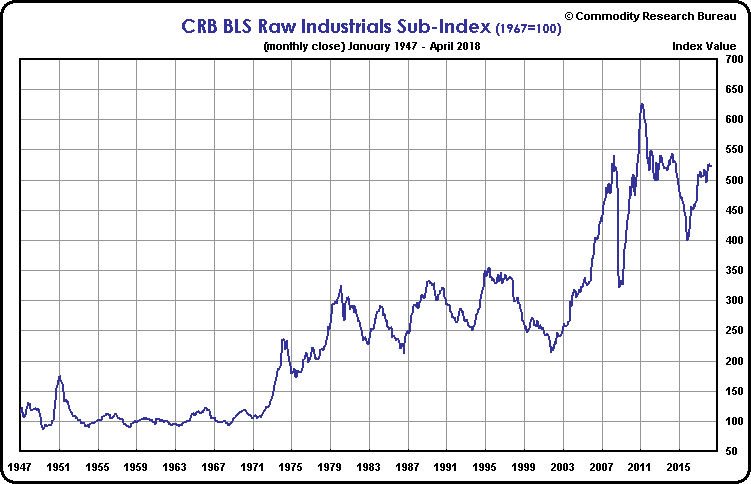
For sure there is a definite shift and turning point in the markets. There is little doubt now, commodities have started a new bull market. The BLS Raw Industrial Index is now up 31% from the 2015 low and will soon be testing long term resistance around 545. A break above 550 will mean a test of the 2011 high will be in order. The chart is to end of April, currently the index is about 522, so little changed.
May 17, 2018
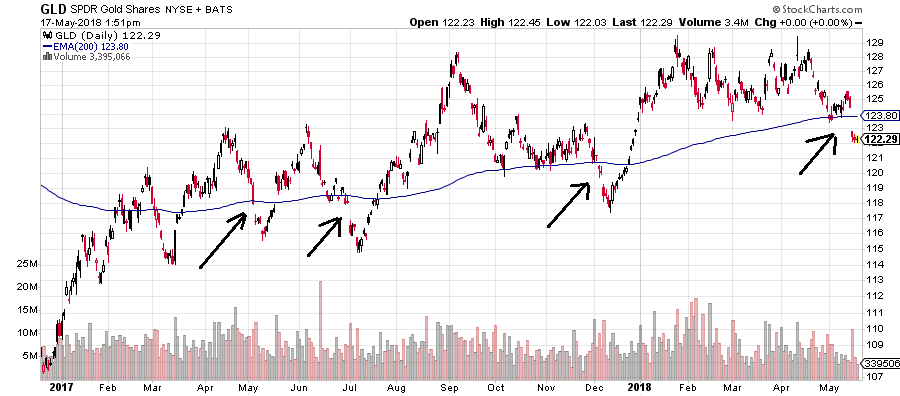
An interesting chart that shows bottom potential is of GLD and the 200 day MA. Since GLD moved above the 200 day MA over a year ago, the last 3 times it gaped down below the 200 Day MA, it bottomed and turned around within 1 – 2 weeks and a substantial rally followed. Looks like a repeat on the way.
April 17, 2018
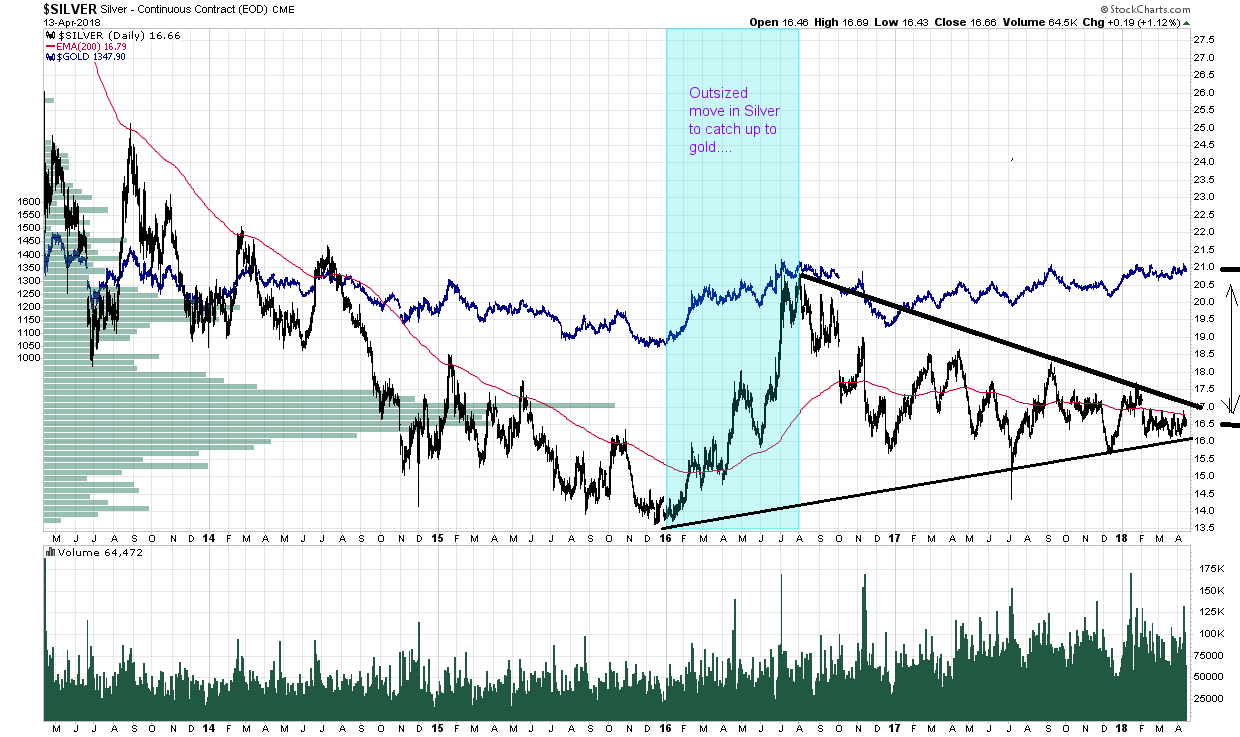
This chart on Silver, compared to Gold, I doctored it up some with trend lines. Long term we see a wedge formation in the Silver price that could mean a break out is around the corner. The last time we seen the gap between Silver and Gold get this large was in late 2015, Silver played catch up then, and probably will again.
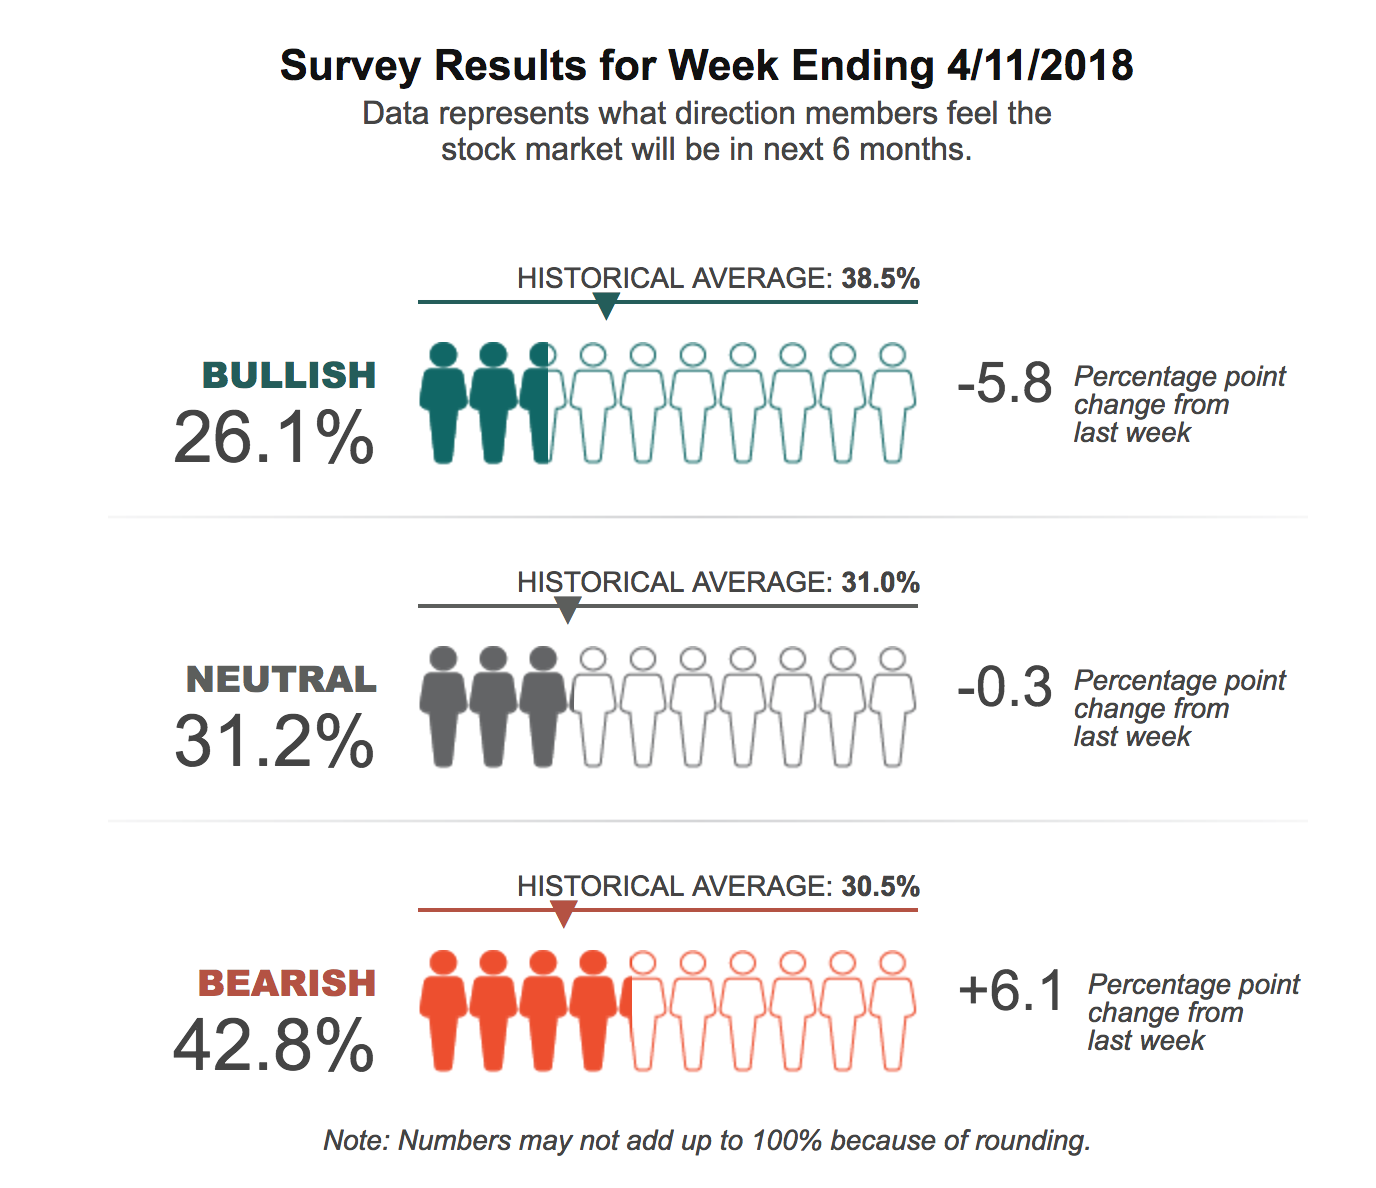
April 14. 2018
What a difference a month makes. 43% bearish, what happened to 'buy the dip' crowd
April 10, 2018
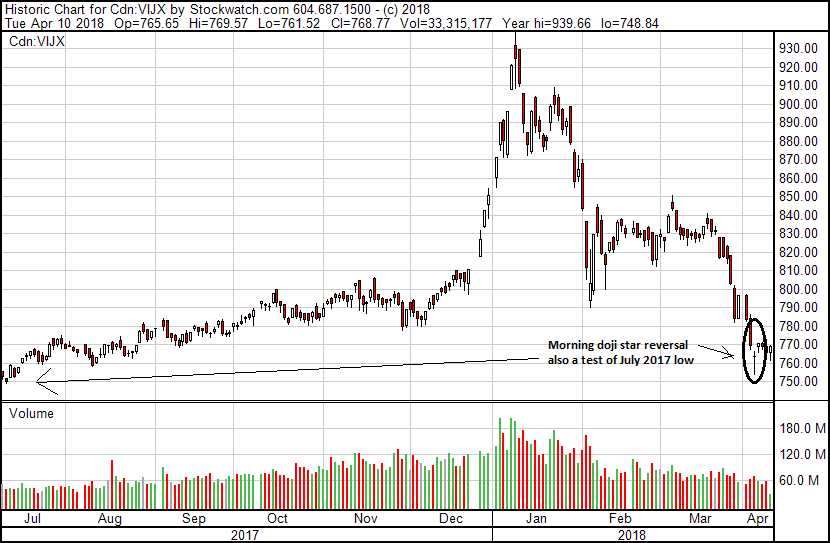
Last week the TSX Venture index put in a morning doji star reversal pattern. This type of candlestick reversal pattern is very reliable, more so than most reversal or bottom patterns. I could find no significant events why this might have occured at this time. It also tested the low of July 2017 which is probably the most significant item of importance about this reversal
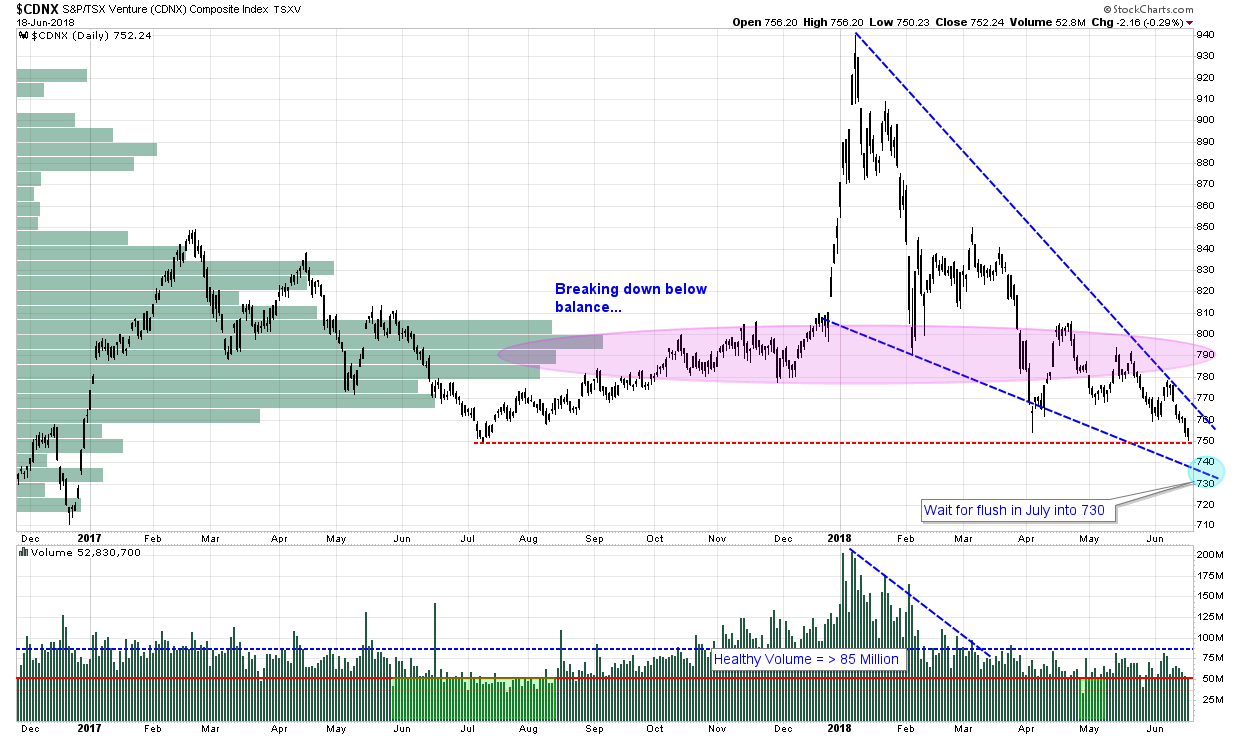
April 4, 2018
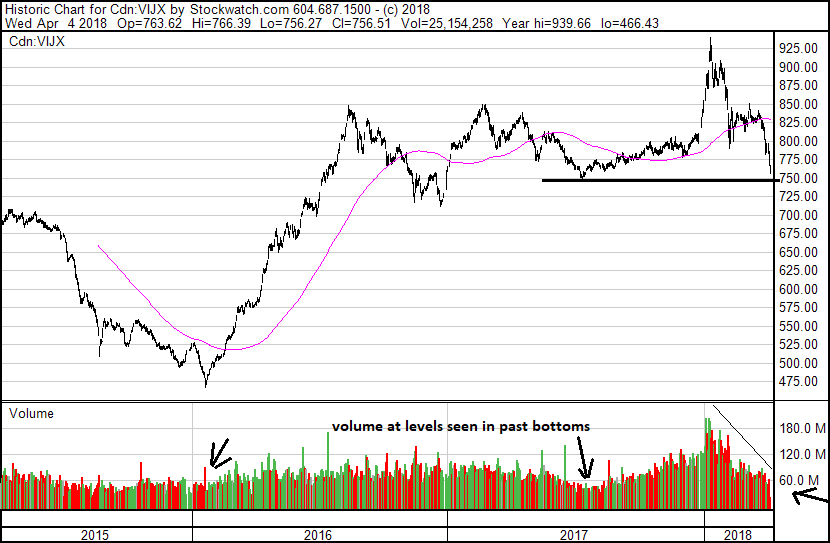
Interesting chart on TSX Venture Index. It has given up all it's gain since the rally from 2017 lows about a year ago. Daily volume is dropping below 60M where past bottoms have occured. Looks like a set up for April/May lows and then a summer rally begins.
April 3, 2018
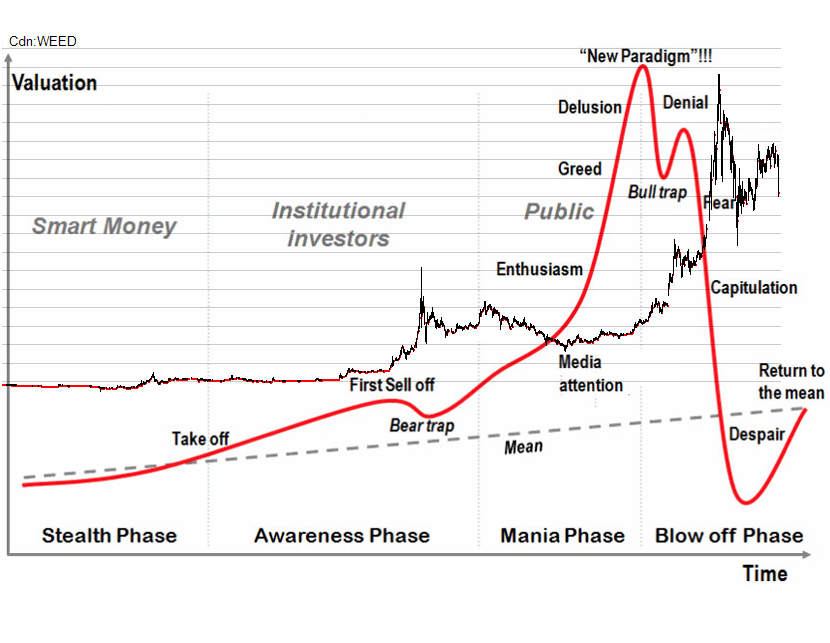
This chart compares sentiment cycle to marijuana stock Canopy Growth. The comparison quite uncanny. I expect a rally to new highs ahead of Canadian legalization in July, but perhaps it will be a bull trap
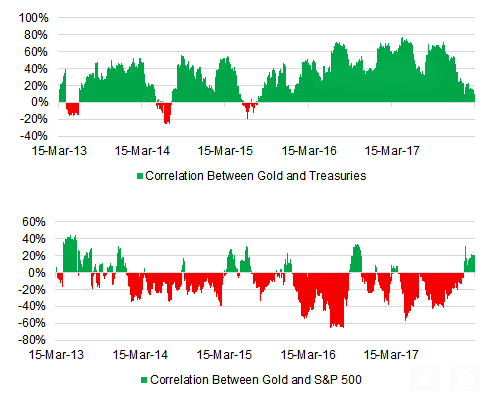
March 16, 2018
The correlation between gold and treasuries (top panel), which is usually positive, has fallen to near-zero. Moreover, the correlation between gold and the SPX (bottom panel), which is typically negative has turned positive. Real rates and the USD will remain key drivers of gold prices. Even so, it is interesting to note changes in the above correlations because of their implications for multi-asset portfolios.
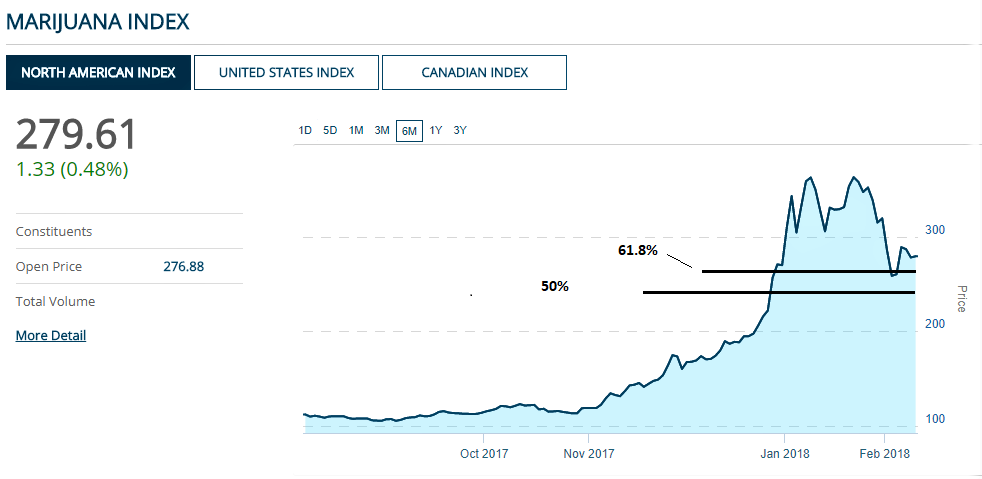
February 12, 2018
The North American index highlights the strong performance in late 2017 and January 2018. The index ran from 120 in November to a high around 360 that we seen in January. The recent correction knocked the index down about 100 points and very close to the Fibonacci 61.8% re-tracement level. After such a strong run up, a correction was warranted and very healthy. I believe this correction provides another good entry point in this market.
You can access my complete marijuana report on the 'Samples' page http://www.playstocks.net/index.php/play-home-articles/example-pages
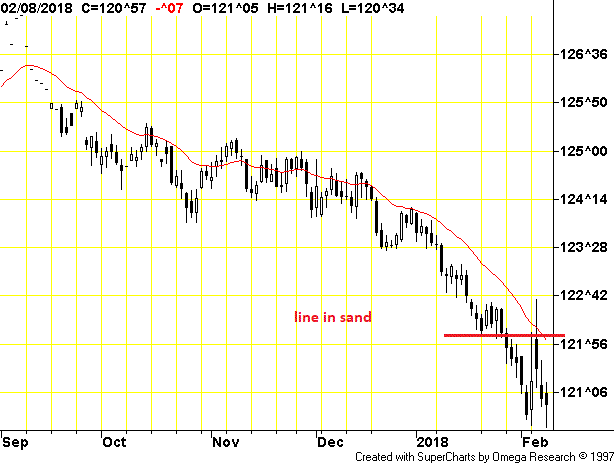
February 9, 2018
The number one reason for this correction is interest rate fears in a market that was over bought. In my update a few weeks ago, I highlighted the 10 year Treasury bond with my 'line in the sand'. You can see below that we fell through than and once that happened the market got jitters of higher interest rates and an end to a 27 year bull market in Bonds.
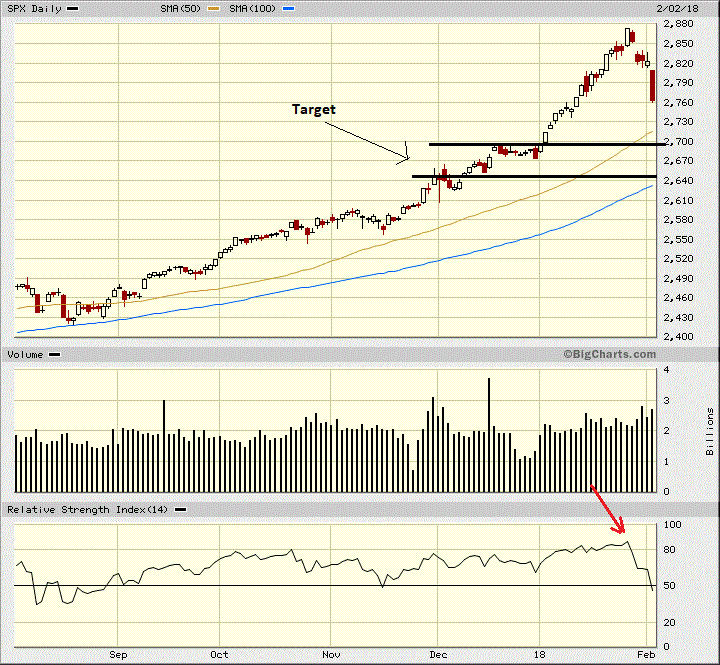
February 5, 2018
The past week there was lots of concern on markets correcting with the DOW dropping over 600 points one day last week. Just relax, this is nothing but a simple correction. I think it has just been so long since we have witnessed one that so many were surprised. I put this chart together on the weekend and did a quick update this morning. The correction could be over today, but I see another possible target down to around 2650 area on the S&P 500. If the market corrected to that it would retrace January gains and only be a -13% correction. Currently the market is down a mere -4%. This correction is very healthy.
January 25, 2018
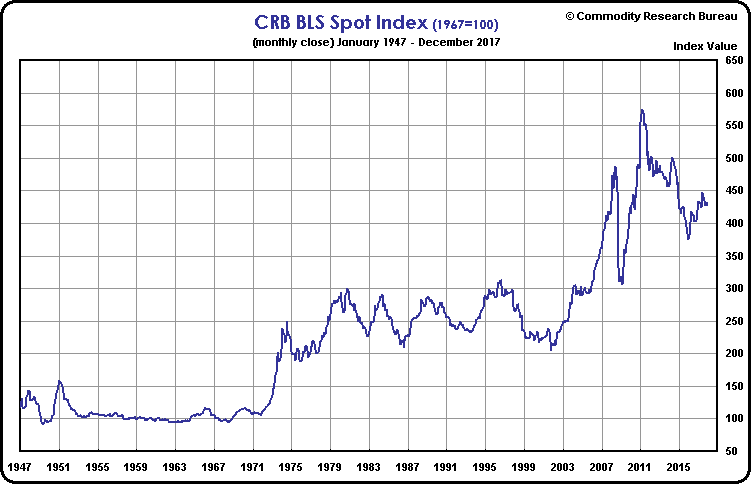
There is commodity inflation too, but you have to know where to look for it. Ever since the CRB index was hacked up into a black box computer model in 2005 that adjusts prices to the down side, it has been rendered useless to measure long term trends or historic comparisons. I now use CRB BLS Spot Index or the BLS Raw Materials as reliable indicators for longer term comparisons. The BLS Spot Index includes food stuffs along with industrial commodities. There is no energy or precious metals component so I believe it provides a strong base or underlying measurement of commodity inflation. The current rally in Commodities is the strongest we have witnessed since the 2011 peak. This chart is until end of December 2017 and we are now around 440, up about 15% from the 2015 low.
January, 21, 2018
Trump got his wish of a lower dollar last week as a break down on this weekly chart is evident. Speaking of Trump, last week the GOP released the highly anticipated fake news awards. I am not sure if Trump started the 'fake news' saying, but he definitely was the one to make it popular.
January 19, 2018
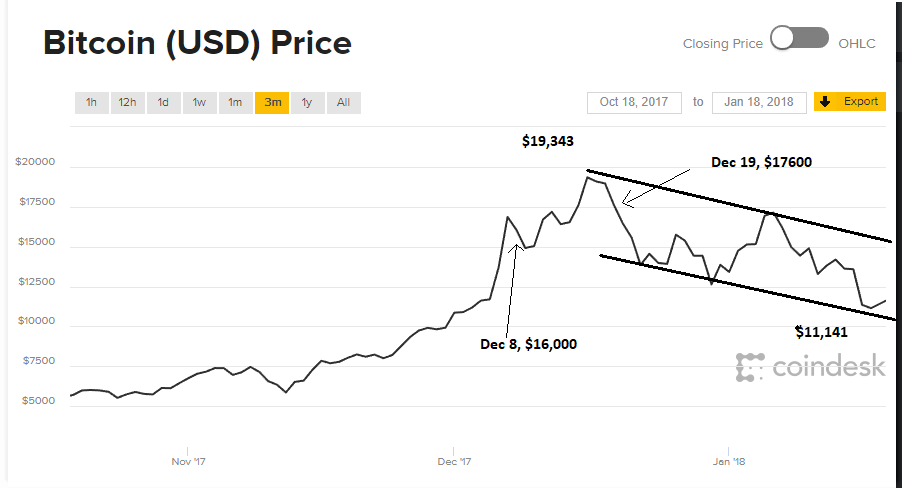
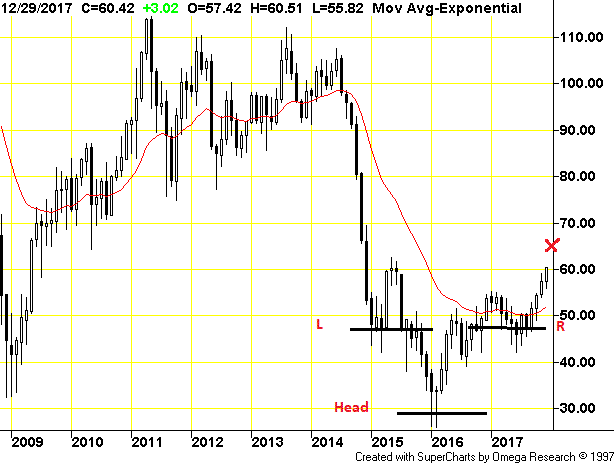
My alert on December 19th and 20th was to sell crypto currencies and Blockchain “BLOC that was breaking down on the chart - it was $2.20 and I was concerned about a close below $2.23. It might bounce back but I am getting nervous on this whole sector because it is so frothy. I would rather take the profits and visit again in January “
It is now January 18th and I am revisiting the sector and what I see is a train wreck and bear market. The two mania stocks RIOT and LFIN have dropped between 50% and 75%. Global Blockchain dropped to $1.40 and is currently in the $1.70s. The leader in the cryptocurrency space hands down is Bitcoin so it is the best barometer of the sector. It is not easy to get charts and this is about the best I found for my purpose. This is apparently closing prices, but there is no close because Bitcoin trades 24/7. I believe the actual intra day peak was over US$20,000 and the low on January 17th was under $10,000. When something drops 50%, the run up or bull market is over. This chart clearly shows a bear market. I highlighted December 8th when I thought it was still going higher and the 19th when I believed it was too frothy. I believe the crypto craze has peaked.
January 9, 2018
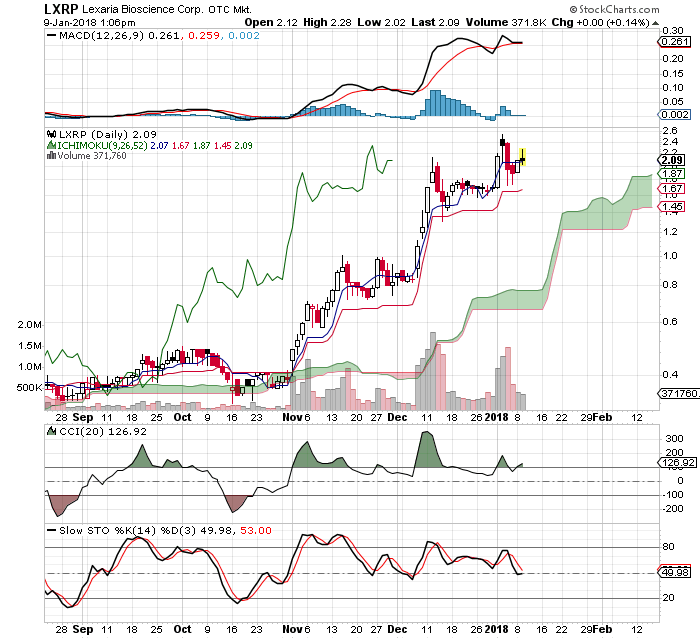
Stock shows uptrend still in progress, above ichimoku green cloud in uptrend. Blue conversion line remains above red base and lagging span positive. Support at 1.87 and 1.67. Opening window from 1.67 to 2.40 strong on good volume. CCI and stochastics show stock not over bought. My next upside target $2.90 to $3
January 18, 2018
Below is a monthly chart on Oil as I wanted to show a longer term pattern. In 2018, Oil has rallied to $64 and is now a clear break out and confirms the inverted head and shoulders bottom.
Dec 31, 2017
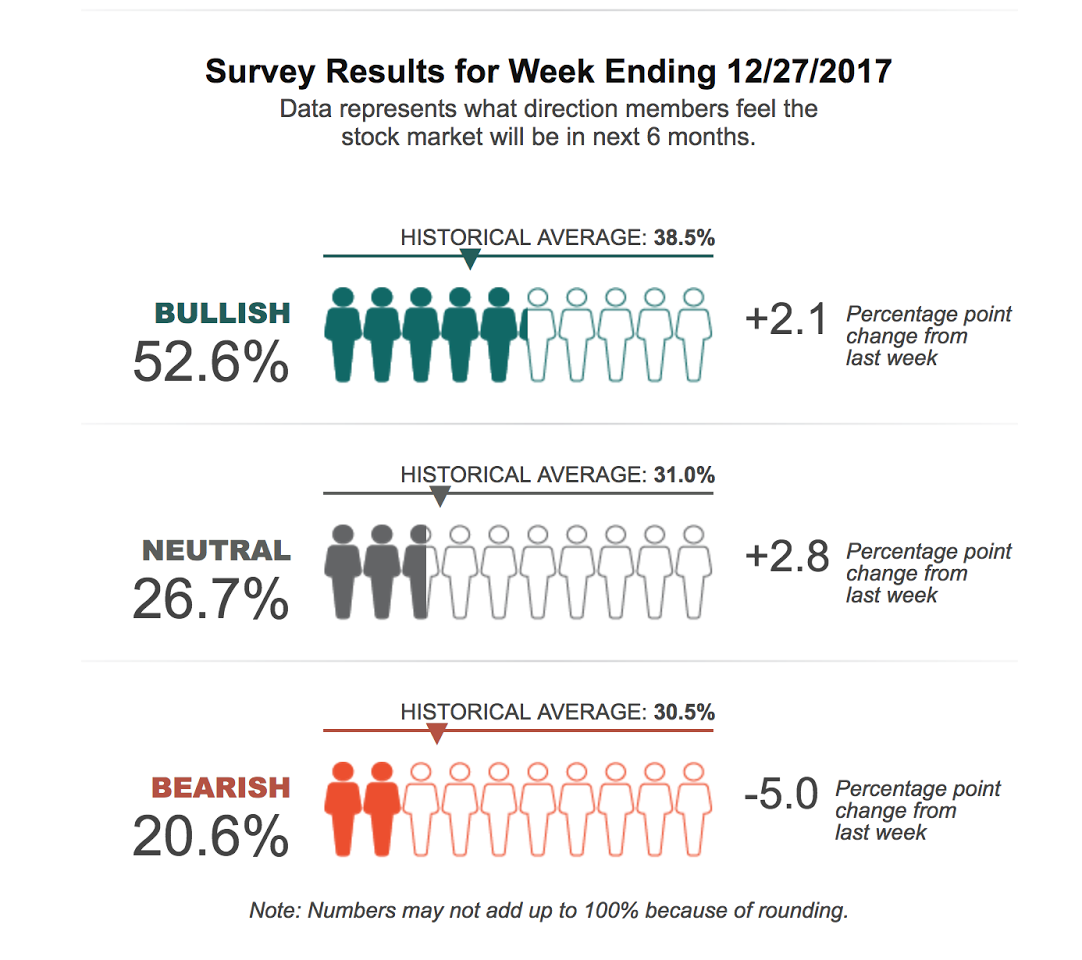
The end of the year brought some strong movement in the AAII sentiment survey. After being fairly stagnant for most of 2017, it seems the Bears are throwing in the towel. To many investors are sounding awfully "giddy" right now. Time to start exercising a bit of caution?
Dec. 19, 2017
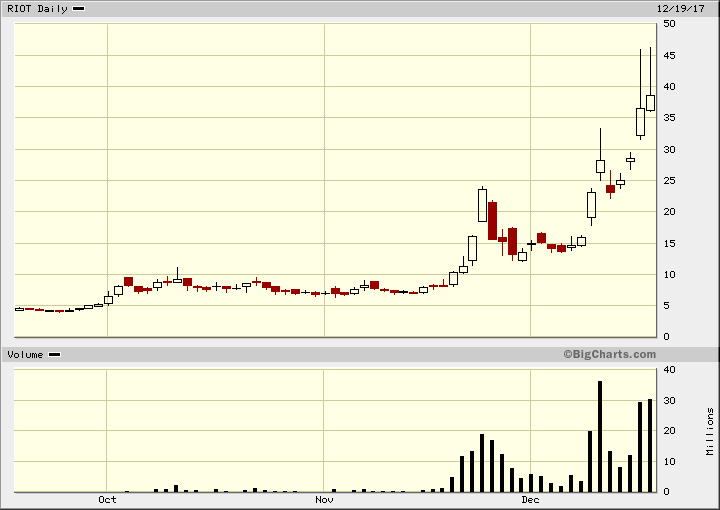
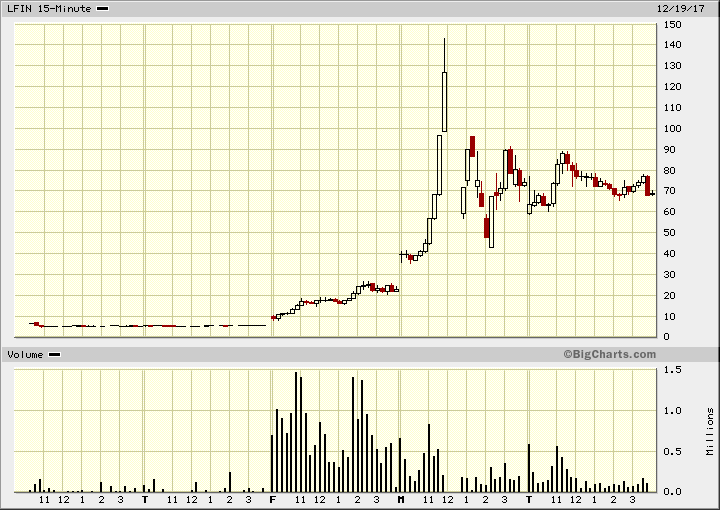
Here is a couple charts on the crypto currency and block chain craze. RIOT is probably a good description of the sector, like a mania riot, LOL. I like the chart on IFIN. No doubt shorts were killed on this one, after shorting on volume Friday then the stock gapping and jumping $120 on Monday. Wow!!!!!!!!!!
LFIN 5 Day chart
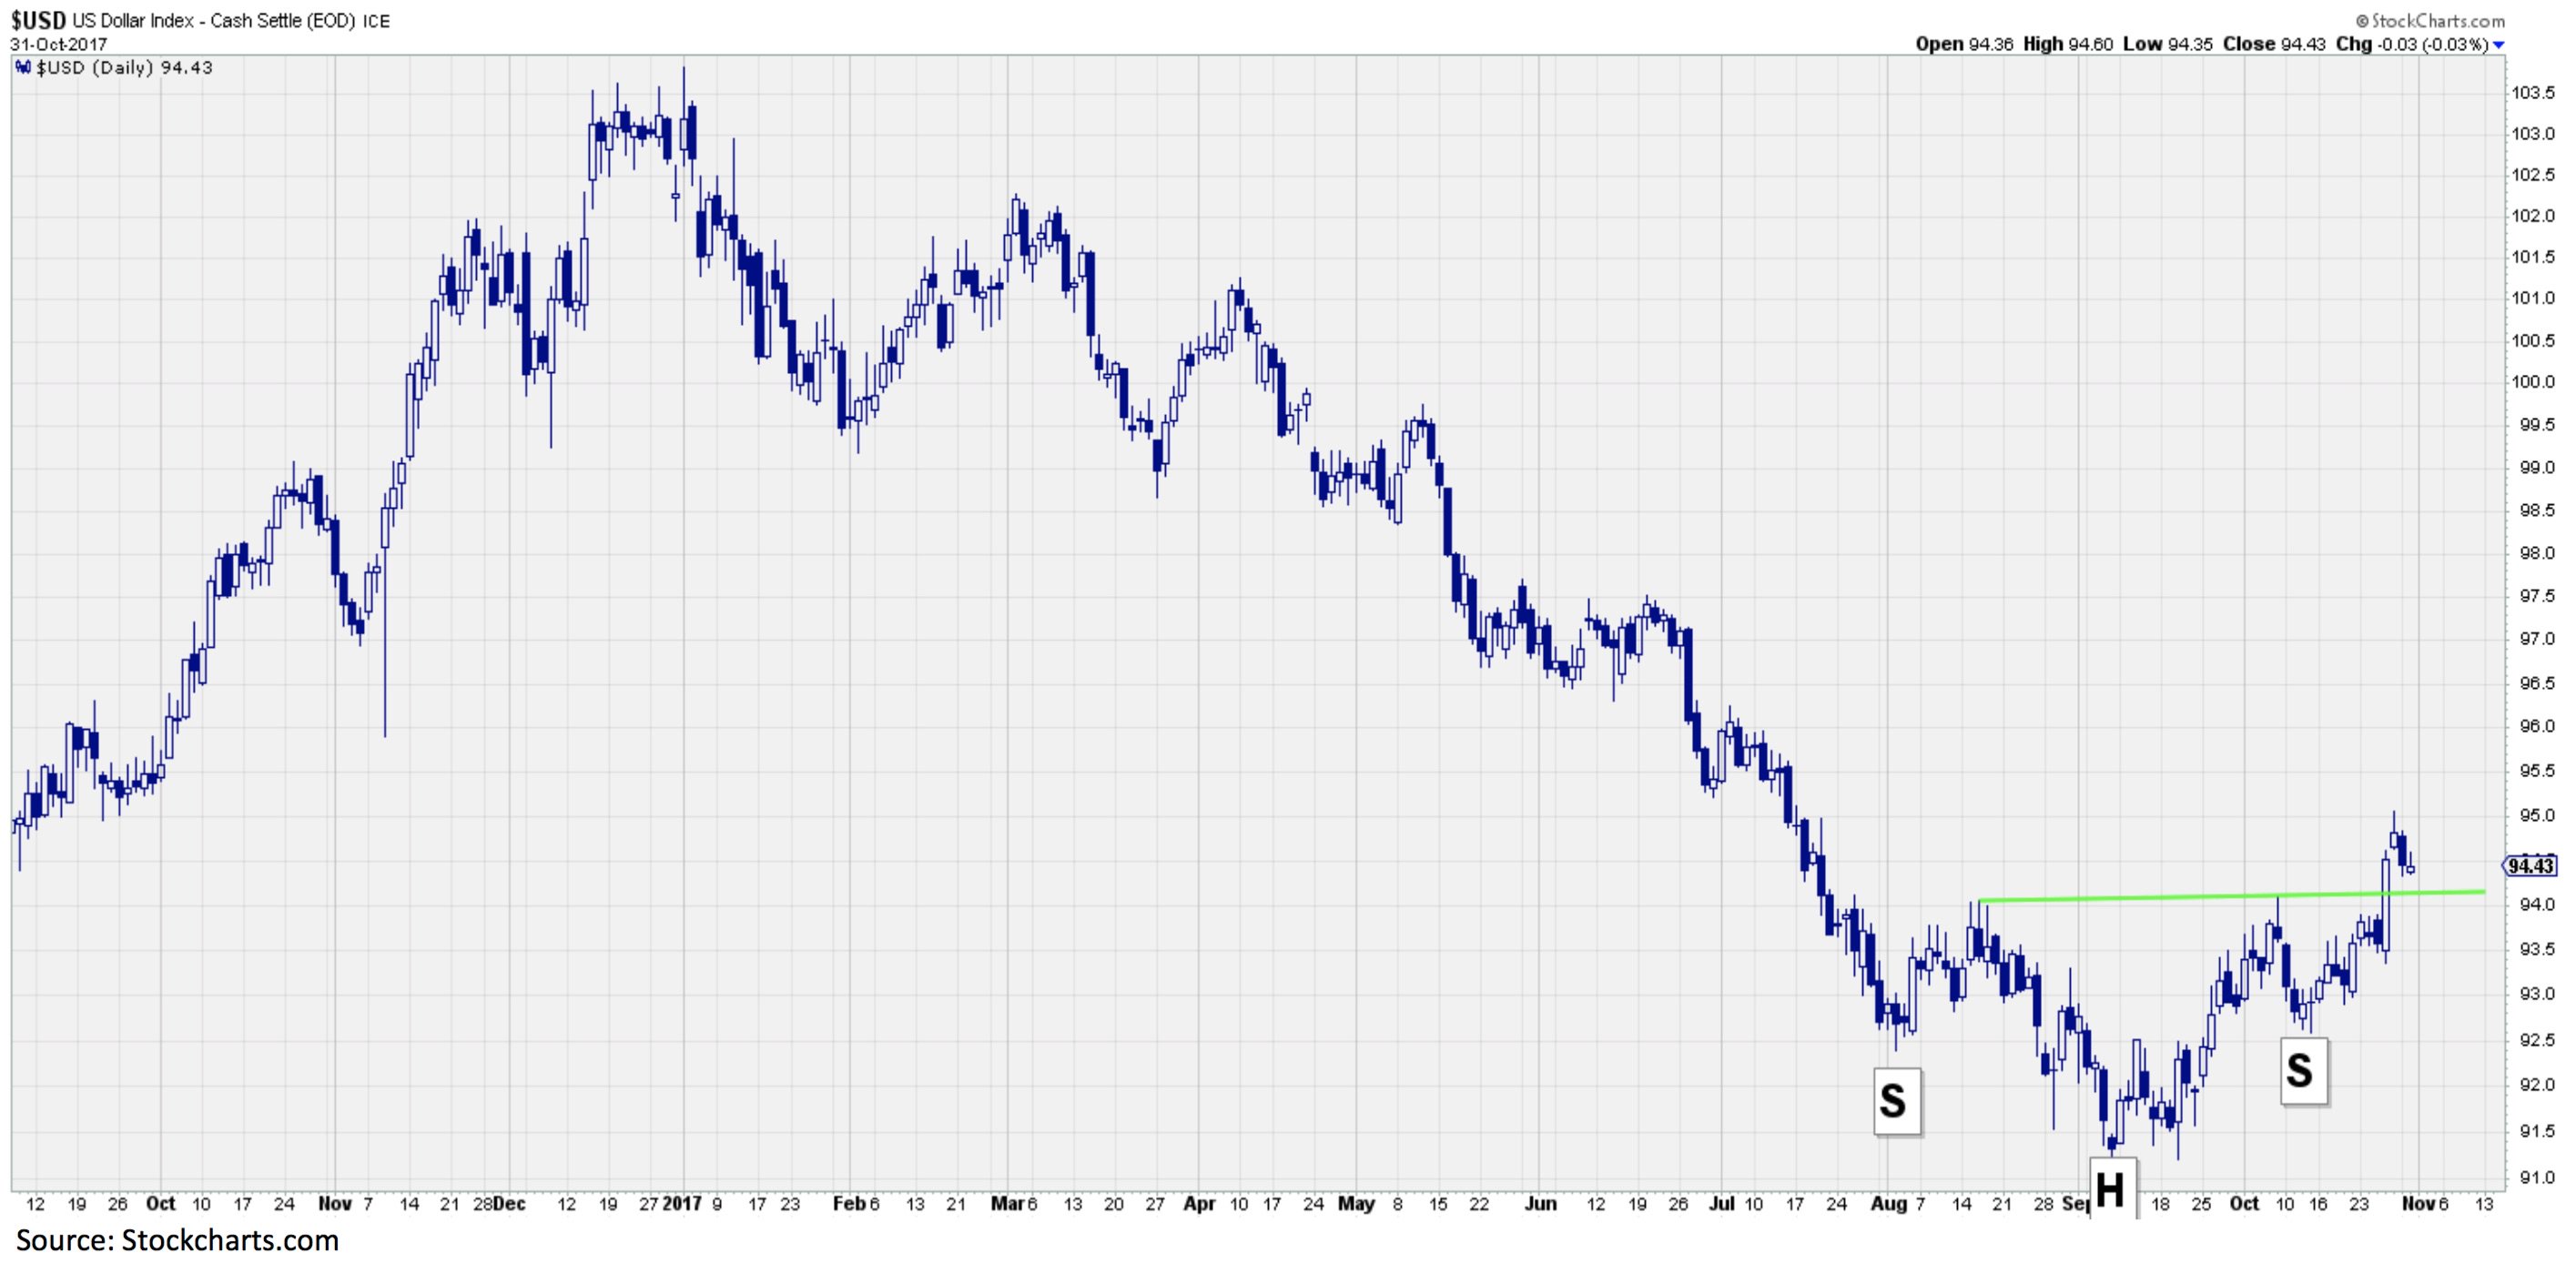
Nov 3. 2017
US$ index has put in an inverted head and shoulders, probably means we have seen a temporary bottom at least and next resistance at 96 so the $ might just remain range bound
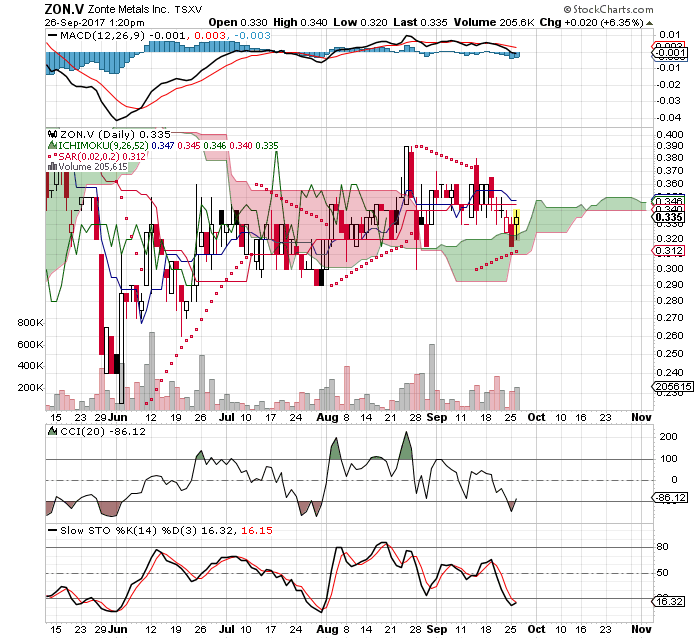
Sept. 26, 2017
For SAR...Up...I use the Fibonacci Summation Series Numbers 1 2 3 5 8 13 etc. Zonte at 9 Change...Positive ...Now marry that with Newton's Law..1 2 3...Related to the Energy Fields Positioned below on the chart...And Zonte's energy fields are in excellent position. Now the final piece Gann Square of Nine ...Wheel 45 from the Cardinal Cross is the Cluster which is in good shape...Day count is also going to cross the week count time frame. Newton...Change of Energy. Looking Good..
Aug 27, 2017
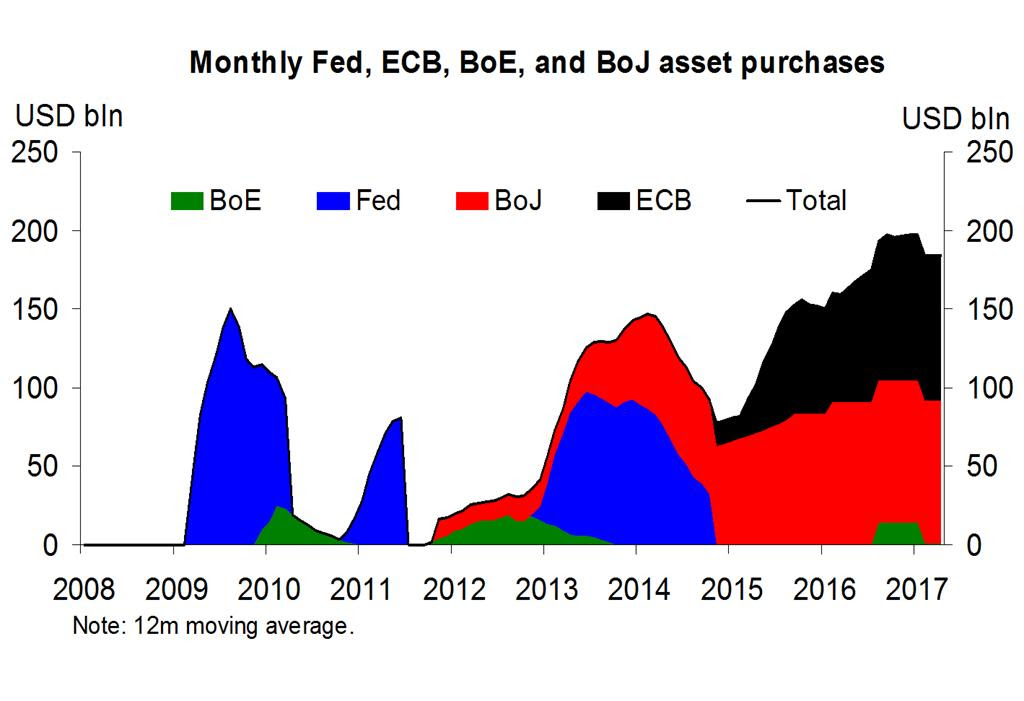
From Sprotts Thoughts - Since the Fed’s final taper in October 2014, there has been a common misconception that global QE has been winding down. As shown below, nothing could be further from the truth. Aggregate asset purchases by the Bank of Japan (BOJ) and European Central Bank (ECB) during the past two years have dwarfed prior rates of Fed QE. Separately, Bank of America’s Michael Hartnett calculates that the BOJ, ECB, Swiss National Bank (SNB) and Bank of England (BOE) purchased $1.5 trillion of assets during the first five months of 2017, or at an annualized rate of $3.6 trillion, far exceeding any historic rate of global QE.
July 23, 2017
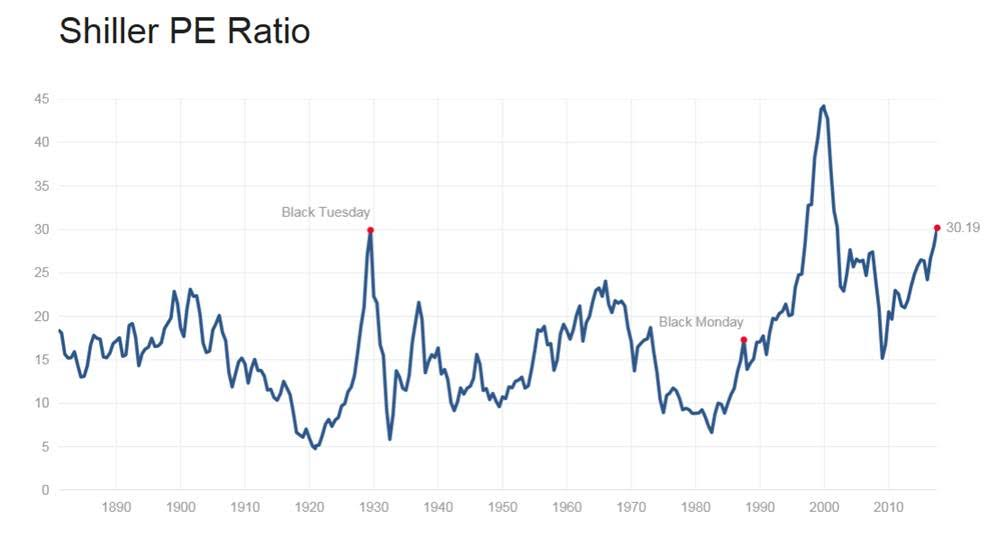
Case Shiller ratio has only been higher once in history, the 2000 internet/tech bubble as it just past Black Tuesday before the Great Depression. The S&P 500 is up about 10% this year. We think good idea just to book the profits and sit out the rest of the year
July 19, 2017
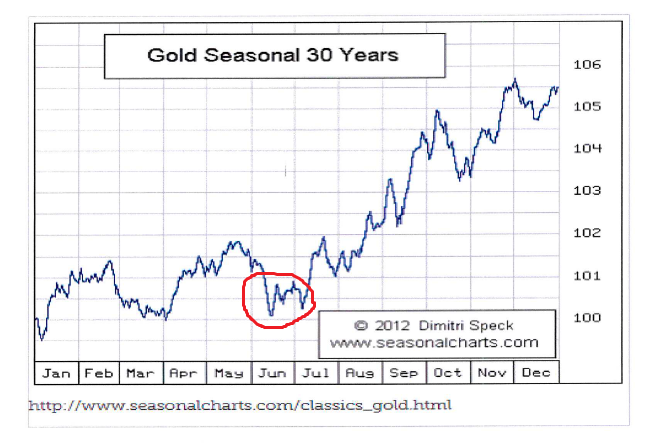
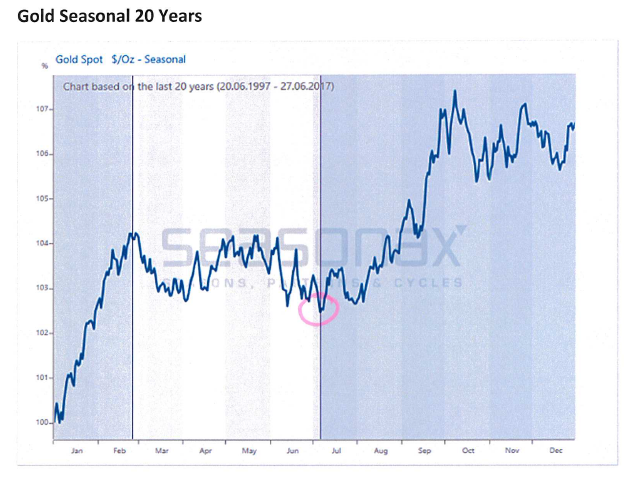
Here is a couple seasonal charts on Gold. It does not mean Gold acts this way every year but on average we see weakness and bottoms often in June and July and stronger prices in the last half of the year. There are reasons why physical demand is higher in the last half of the year, but remember prices are most influenced now by paper trading rather than physical but it seems these trends are still often in place.
July 16, 2017
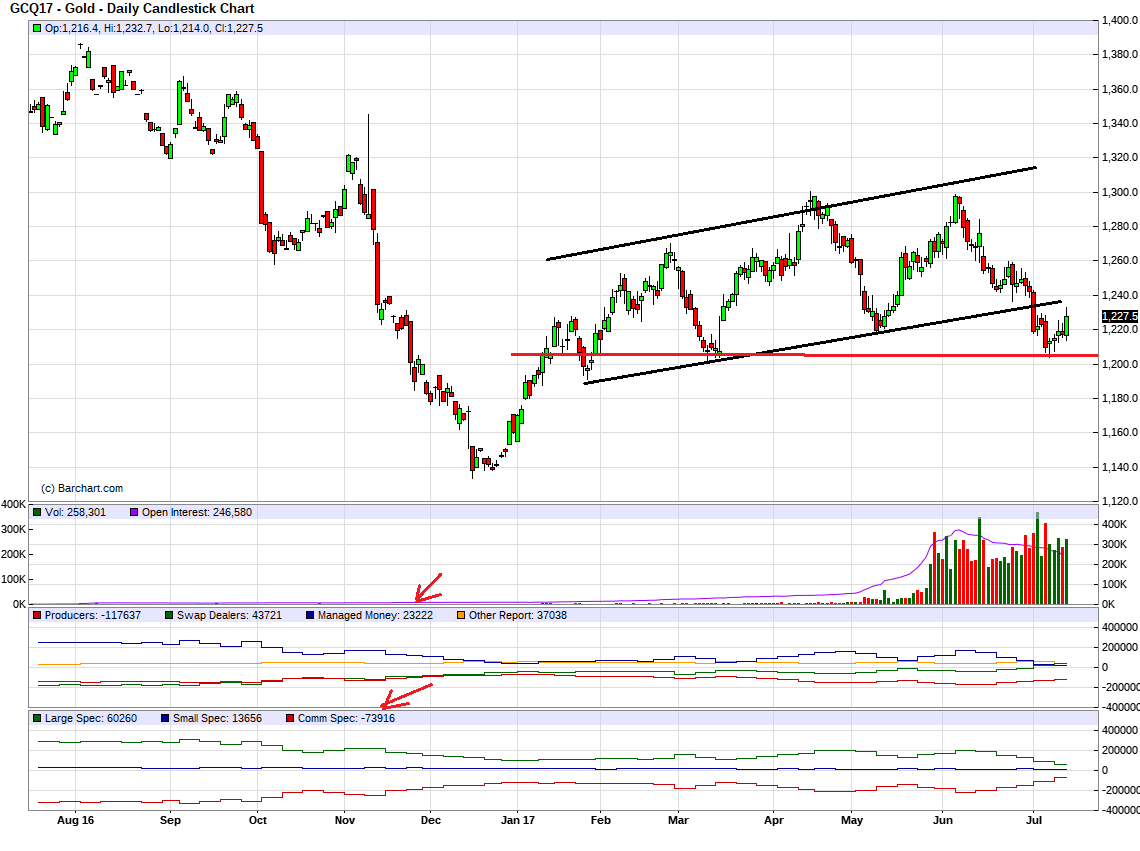
I note that the managed money long position is down to just 23,222 contracts from almost 200,000 at the early June $1300 high and Commercial shorts down to 73,916 contracts. Although these could go lower and they might because of the reporting delayed time frame, it is the best set up on the COT report since the December 2015 lows in Gold. The chart goes back one year and looking at the bottom graphs you can see the set up has not been this good in the past year. Pretty close in December 2016, but the Commercial short position was larger then.
We seen a bear raid June 26th (wee hours Monday) These things get labeled 'Fat Finger' trades or 'Flash Crashes'. More importantly this was just the first of three of these bear raids. We have seen a short bash Sunday June 25th, Sunday July 2nd and Wednesday July 5th wee hours with the July 4th holiday.
The short bash July 5th from 3am to 6.30am was a complete failure because Gold totally recovered to $1226 by the end of the Comex session that day. When I add my observation of price and market action with the COT report I am very confident that this recent correction is over. The Flash Crashes managed to break the bottom of the up trend channel but could not break the stronger support in the $1200 to $1220 area.
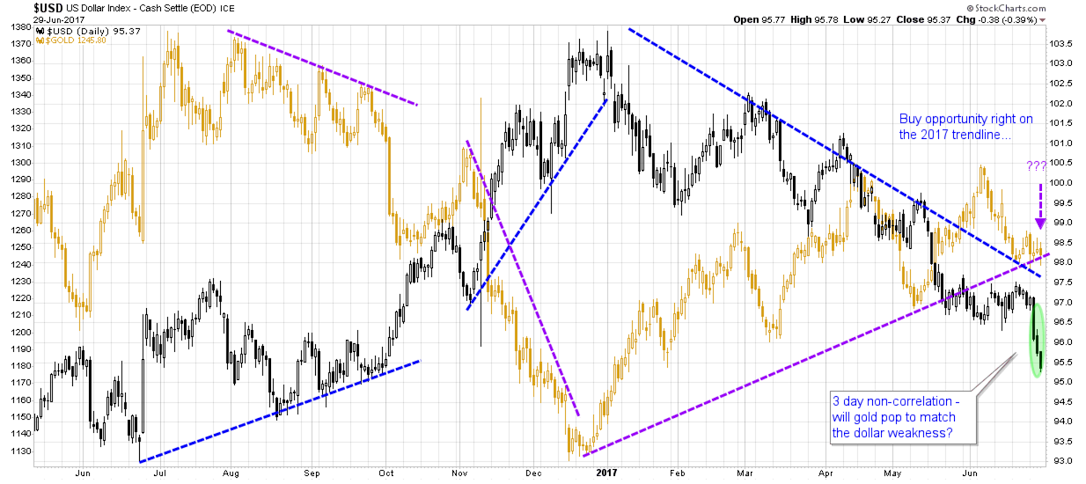
June 29, 2017
Weird disconnect between gold and the US dollar. Great symmetry in the past year between dollar and gold. I don't see any reason for it to break down at this point - we should see a move to a new 2017 high imo just off this dollar breakdown.
June 14, 2017
Leadership in the market is down to a handful of large tech stocks. Pretty much everything underneath is broken. Like how are commodities so out of favour at the same time as the dollar and the financials and the small caps? Curious.
June 13, 2017
I believe we are setting up for a summer rally, especially in the Gold stocks and the 'Sell in May and go away' will be proven wrong again.
We have a pattern and trend of higher lows because of strong underlying buying pressure in the physical market. June is probably the 2nd busiest trading month next to December and what I found of real interest - when Gold was taken down to $1220 in mid May, piles of London options with exercise at $1260 did not care, they hung on and at month end exercise time - Gold was back to $1260.
To me they said - 'we do not care if Gold is lower', they were willing to exercise and take delivery and pay $1260. There is strong support around $1250 and another reason Gold could not stay below this very long. We are seeing typical weakness ahead of a Fed meeting with a ¼ point rate increase already baked in for Wednesday. Gold will probably rally after the rate hike and $1250 area hold.
May 20. 2017
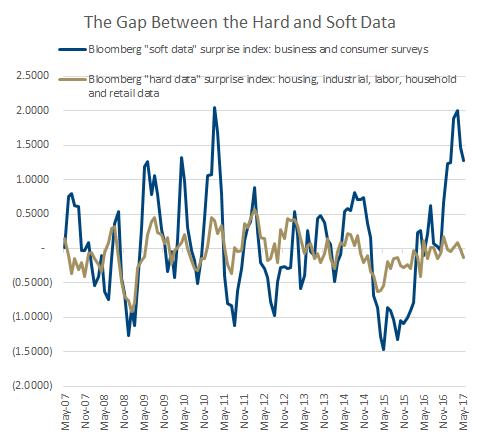
Interesting chart from GMP - Soft/weak/useless data is creating a lot of noise while Real data is flat'ish.
February 7, 2017
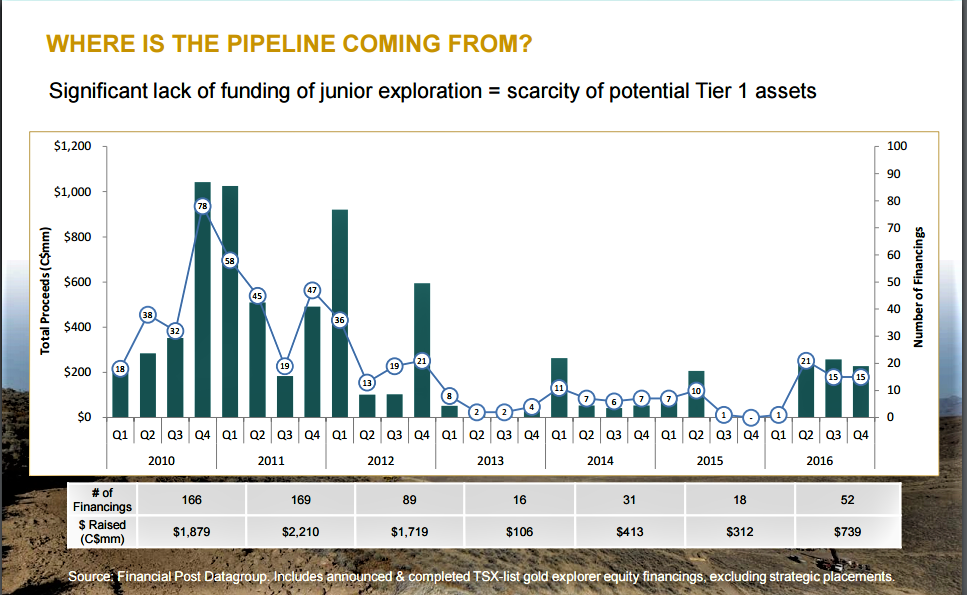
After some holiday time and a busy period we are back with some charts. This is another view of the Gold bear market, which we believe has ended. It measures the amount of financing coming in to fund the project or mining pipeline. It has been very poor since 2013. Note at the end of 2015 and Q1 2016, it was virtually dead man walking. We believe that junior stocks with great projects will become the market darlings in the sector in the years ahead. Their rarity will mean very high buy out valuations.
December 13
Oil market breaks out. This is a weekly chart of WTI Oil futures so drew in the last candle for Monday/Tuesday and we now have a clear breakout above $52. There is some resistance around $60 but nothing major until the $85 area.
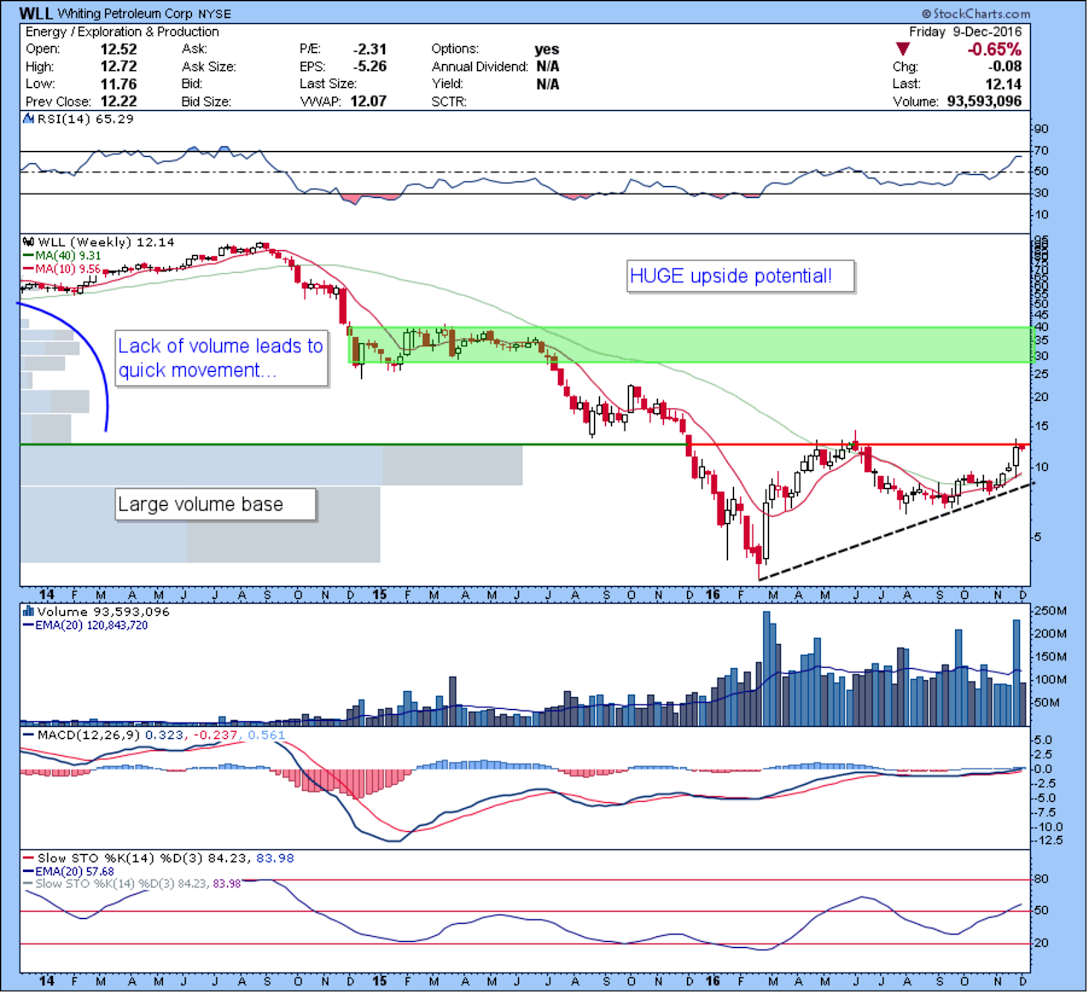
December 10
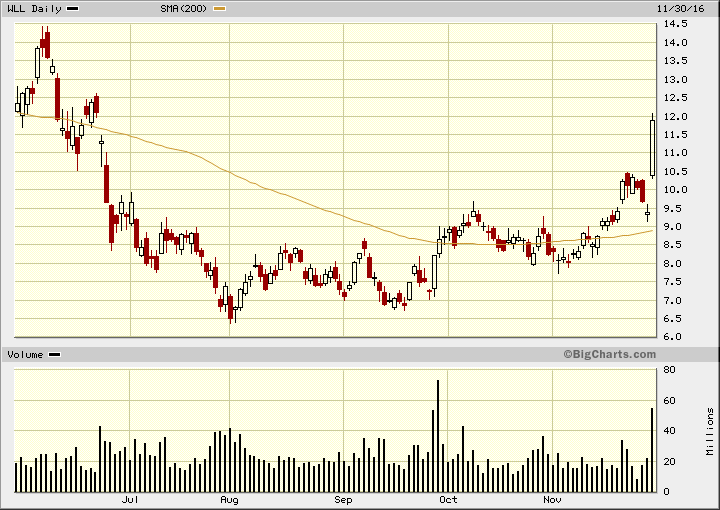
Whiting WLL - Very bullish base pattern with a large volume pocket overhead. With the absence of volume you get fast moves. It can break out at anytime dependant on the price of crude. Looking at March 2017 $13 Calls under $1.00.
December 9
Probably is - or blow off top to 18 or 19?
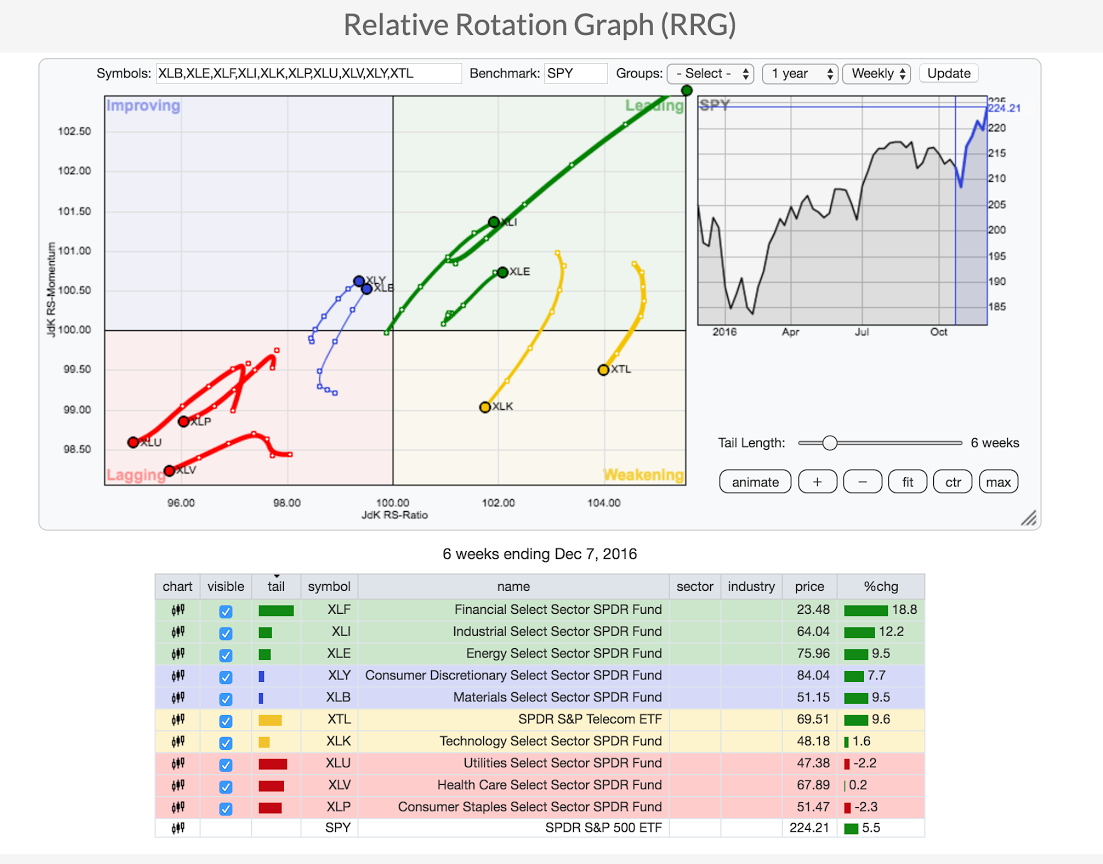
December 8
Never seen such a strong rotation before...where the line for the XLF is literally off the chart!
To me looks like $$ coming out of more defensive sectors like utilities, health care and consumer staples and going into financials?? Industrials - I'm assuming people we're generally underweight the space and it's a buying panic now.
XLF has been overbought for the last 17 days. It will come to an end, but when??
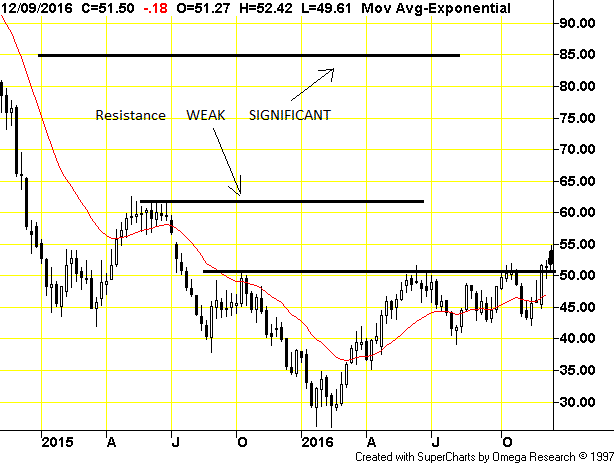
December 7
This rally could really have legs - no buyers....no sellers. No participation (lack of volume is surprising..) means the air pockets on the downside could be very sharp. If participants aren't seeing a buying opportunity at these levels - why would they see a buying opportunity higher?
December 5
Oil bulls will claim there is a slight up trend on the chart. Bears will claim that 3 attempts and a break out failed. We believe the later untill we see a good close at $53 or higher. It will happen, but still a matter of when. Probably require proof of OPEC cuts and/or decent drops in Inventory from EIA
December 1st
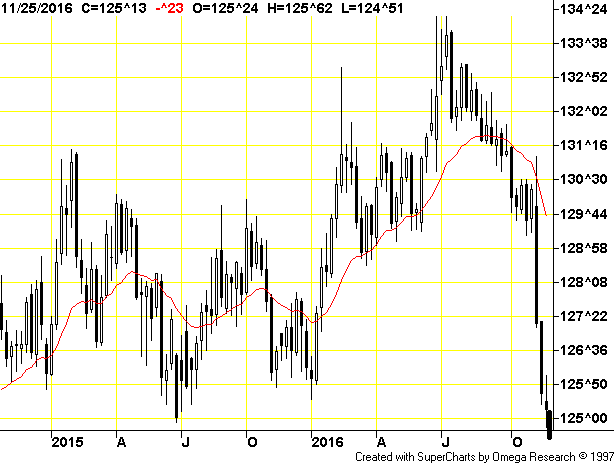
This morning it appears the Bond markets are breaking down. The 35 year old Bull market is ending. Below is a weekly chart of the 10 year treasury bond and we drew in the last candle with a drop well below the 125 level we were watching. Same with the 30 year treasury falling well below 153. We will need a very bad jobs report tomorrow to rescue bonds.
November 30
Whiting Petroleum NY:WLL shows us a very strong doji morning star reversal pattern. We see the down day on Monday and the gap lower on Tuesday with a doji star, marking indecision. Today we see the resolution of this indecision with the strong gap upwards. We suggested buying Whiting in our Seeking Alpha article in late October. We also suggested to buy the January 2018 $10 Calls around $2.30 at the time. With this strong reversal, higher prices are expected.
November 21
Because we made a typo, the 'w' in triplw represents triple top, We would like to see a little more strength to declare a breakout and a retreat from here, a triple top (IF it occurs) would be bearish long term. Bullish sentiment last week was over 90%, Readings this high are very rare and often signal tops.
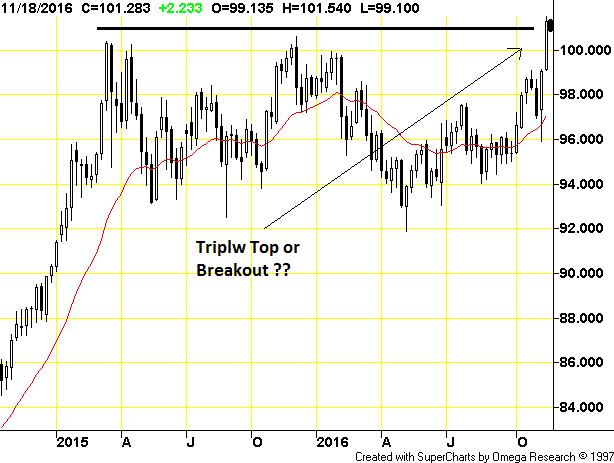
November 18
Don't panic about Gold, it is having it's typical year end weakness. It has dropped into year end, every time since 2008. December is the most important contract month for Gold, a lot of hedge agreements and financings are based on the year end closes so Banksters always want weak prices at that time.
Out of the 9 years in a row it has gone down, it rallied back up in 8 instances and we expect a repeat this year. Same song - different dance. December Comex Gold options expire Nov 22 and December weekly options Dec 2.
The December futures expire December 28th, first delivery is December 1st. For sure we expect no significant rally in the next 2 weeks.
November 17
The 10 year Treasury Bond has been testing what we see as the next support level around 125. So far this is holding, but a drop below could be very bearish, but there is a little support down to about 122.5. After that we would likely see 2011 levels.
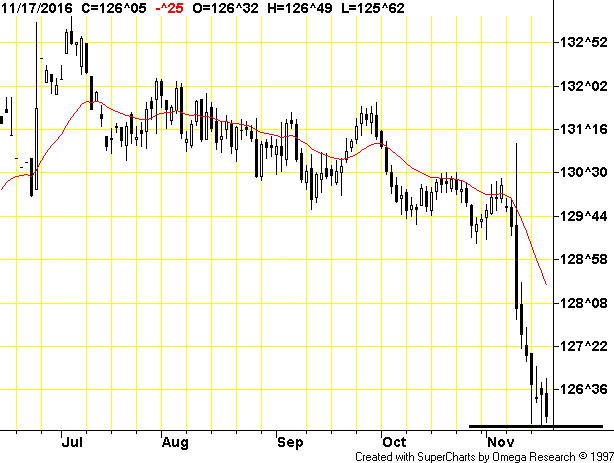
November 14
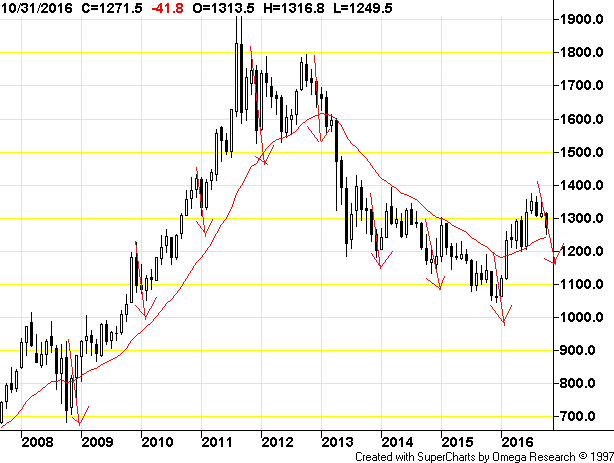
Gold is at critical support. We believe it will hold and will move back up. Trump is more inflation and current price is short term arberration
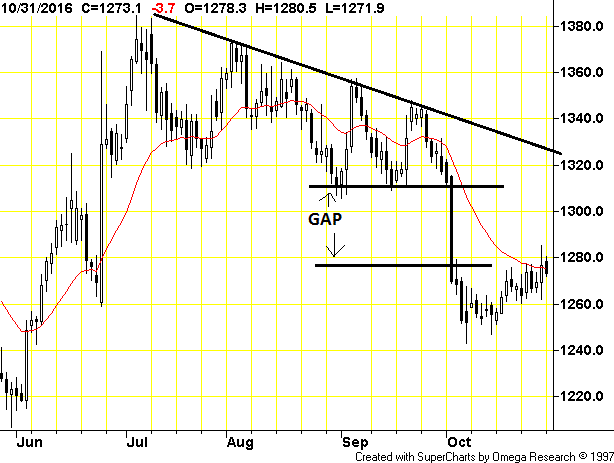
October 31
Its Halloween and the most scarey thing is the U.S. election race


Gold looks like it could fill the gap up to $1320, driven by a move back down in the US$ and election uncertainty. MACD also gave a buy signal several days ago. For the record we are predicting a Trump win. Simply because everyone is fed up with the establishment, we seen it with Brexit and now will in the U.S. I believe Polls are too close to call and generally they are skewed some by the status quo, most just can't imagine something other than what the establishment is pushing, and my have they been working overtime bashing Trump in the main stream media. Trump is good for gold. Clinton is good for gold - so either way works for the gold bugs.
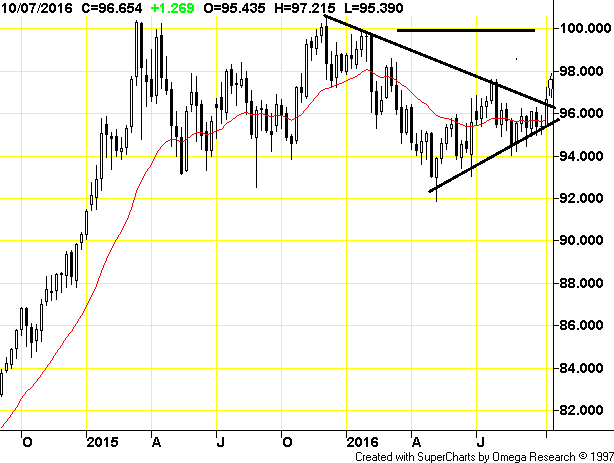
October 13th
On October 4th we sent our readers a number charts showing breakouts of wedge formations including the US$. This is a weekly chart of the US$ index and you can see the breakout of the wedge last week. We drew in a crude candle to represent this week so far and are closing in on 98. We expect we will now see a retest of the 99 to 100 area, forming a triple top, that would spell out the final top in the US$. In the short term this could mean a bit more weakness in the US$ Gold price and it is not good for the stock market as it is a negative factor on economic growth and corporate profits. It also means there is no way the FED will raise rates with dollar strength.
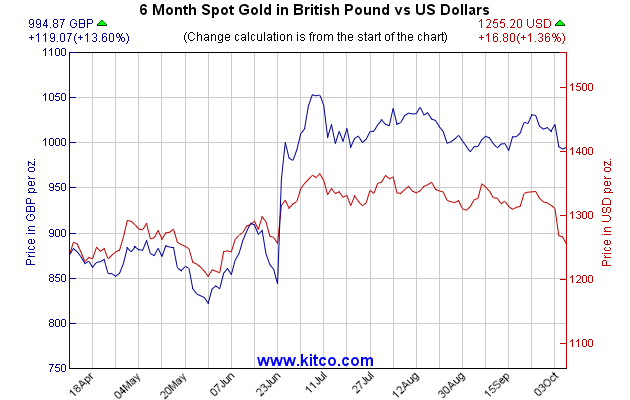
October 7th
We all think about the price of Gold in US$, but Gold is a global currency like other currencies. The Brits have been buying Gold like crazy pre and post Brexit and it has served them very well. Sure they could buy USD, but probably already hold those too. This chart from Kitco, shows the Gold price in pounds is a much different story than in USD. And it does not include the $50lb pop this morning as the pound plunged 6%. That is being blamed on a fat finger, but that is another word for computer algo flaking out. Maybe we will update the chart this weekend after Friday's data
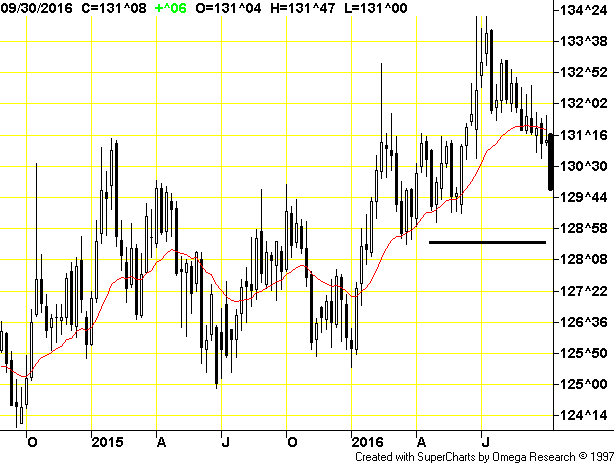
October 5th
There is something wrong in the Bond and Financial markets. There has been much speculation about Gold getting taken down so hard during Chinese Holidays. The two main theories are the large commercial short position wanted to use the opportunity to whack Gold and cover shorts, or there is some big problem in Financial markets and it would be best if this news breaks with Gold much lower - contain the price and preserve the strength in the US$.
It might be some of both, the chart below on Gold Oct 4th shows the large managed money long position, the commercial shorts are basically the opposite side of the trade on the chart - we will post a new chart to compare when COT data comes in for this week. That will be October 14th, well after the fact. But what is obvious now is there is a problem in the Bond market. Repo rates were up some more this morning almost another 0.1%, but look at this chart of the 10 year treasury bond.
This is a weekly chart, so we drew in the black candle for this week so far. Bonds have been dropping since July and the pace really picked up this week. It is not FED propoganda about raising rates, that story has been around forever. There is some underlying trouble in the financial sector. Could it be Deutsche Bank or are the big banks using a market threat to ensure Deutsche Bank receives a much lower fine. It was expected the DOJ might impose $14 billion in fines for the 2008 mortgage scandal, but now the talk is $4 to $5 billion. Their $47 trillion in dirivatives? who knows, October is the scary month so if something is going to hit the fan, it won't be long!!!
We are watching the level just over $128, a fall below that would be a further bearish signal. And don't forget, someday the markets will no long support the huge U.S. debt at these ridiculous low rates, so we keep a watchful eye for signals of the day of reckoning.
October 4th
In early morning trading Gold was breaking down through it's wedge and so was the Euro breaking down and US$ breaking to the upside, as shown by the 'X'. The Pound and Yen were weaker early this morning also. These trends were continuing in early morning, until noon when the U$ reversed and gave back all it's gains, The Euro reversed and is actually higher, the only thing not reversing is Gold and probably points to a buying opportunity.
But interesting -
Bonds were higher in early trading but reversed and plunged by 10AM. there is something unusual today. By Noon bonds have plunged further!!!!!!!!!!
There seems to be something strange in the financial system. The most obvious and important observation is the repo market. I talked about that market late in 2015 as a way the FED could use it to raise their ¼ point.
The REPO market is a key short-term funding source for Wall Street. It tumbled on Monday from its highest since the global credit crisis almost eight years ago, but it remained elevated on signs lending had not fully resumed by the start of the fourth quarter.
The interest rate on repurchase agreements, in which financial institutions use U.S. Treasuries and other securities as collateral to raise cash from investors, was last quoted at 0.75-0.80 percent after falling as low as 0.30-0.40 percent earlier Monday, according to ICAP data. USONRP=GCMN
The overnight repo rate rose as high as 1.75 percent on Friday, which was last seen nearly eight years ago during the height of the financial crisis. This market is often volatile at quarter end and start, but this time it is way more extreme. One analysts notes - if this lasts until Wednesday there is some fundamental change.
It is hard to get up to date quotes except on the repo futures index, and that seems quite delayed, but early this morning the December futures were down, meaning interest rates up and probably why Bonds continued to fall.
There seems to be a knee jerk down in Gold, probably responding to the stronger US$, but if the repo market problem manifests we will probably see a move back up in Gold, as it will become obvious there is a problem in financial markets. $1300 was holding as support, but with this break lower, I think the bottom of the correction will be found between $1260 and $1280 filling the up Gap we seen in late June. With all the reversals today, the bottom might be right now.
For traders, I would not be shorting Gold now but looking at levels to go long.
September 27th
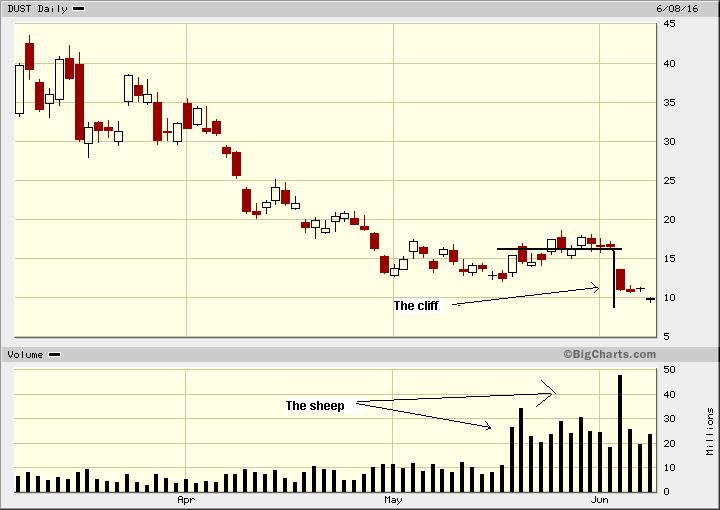
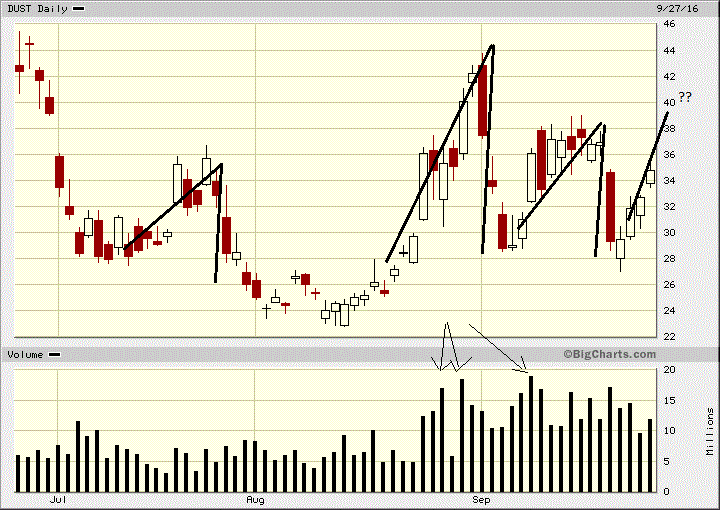
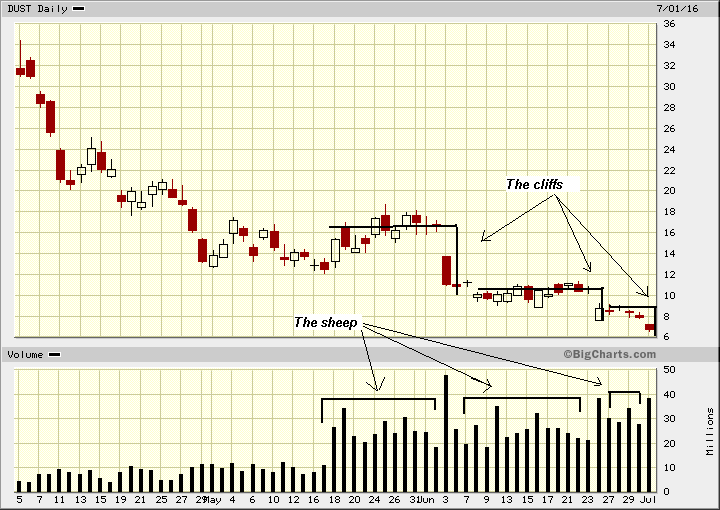
Honestly, we have no grudge with the 'DUST Sheep' but we have seen a new pattern emerge. Previously on 3 or 4 occasions they were simply led along the pasture and over the cliff (see July 5th below). Give them credit - the survivors became wiser! Now we see they are led up a hill side so they cannot see a cliff coming. And my, my is it working well, see how the volume has picked up and more are being slaughtered.
Now at least the better part of this pattern is that some sheep have been able to enjoy the greener grass up the hill and head back down before going over the cliff. Since most sheep (volume) join near the top of the hill we should see DUST go higher and volume go up. But beware this would be the 4th time they are led to slaughter this way so may have become wiser again??
September 7th
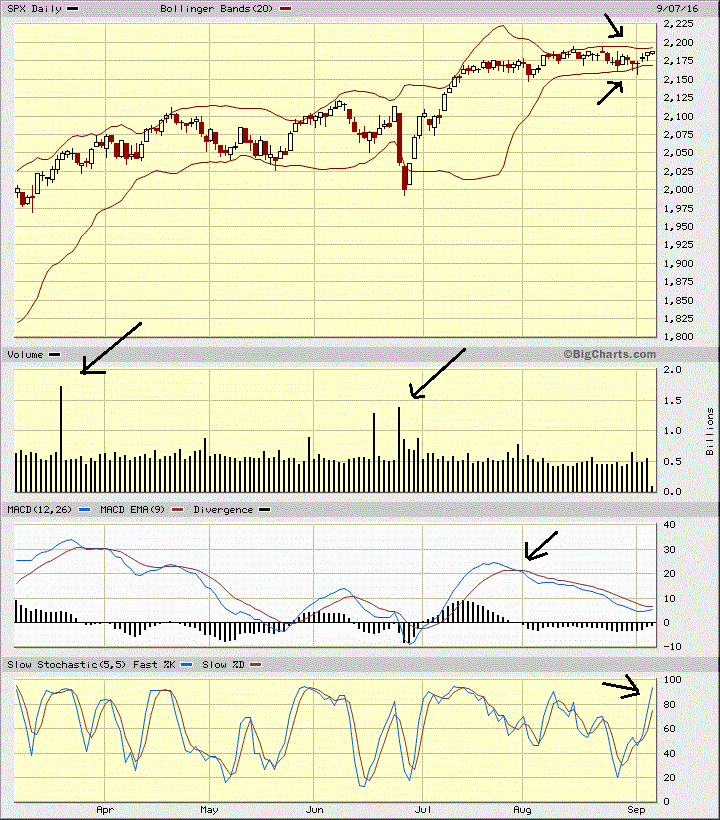
This chart on the S&P shows the Bollinger Bands are pinching so a break out could be imminent, will it be up or down?
Despite the market holding up MACD has been trending down and the 26 Day has already crossed the 9, it appears we are approaching the Zero line as well. Stochastics have also moved into the over bought area above 80.
It is looking like the break will be to the downside. That said, ideally we get a one day spike, a paper umbrella or doji star to signal a top, but that might not occur. Big market players try to hold things together until triple witching which is later this month. You see it on the charts with the volume spike. After April triple witch we went higher. In June it was down and back up, so we could continue sideways for a while longer, but I would be raising cash levels and watching for an ultimate short signal
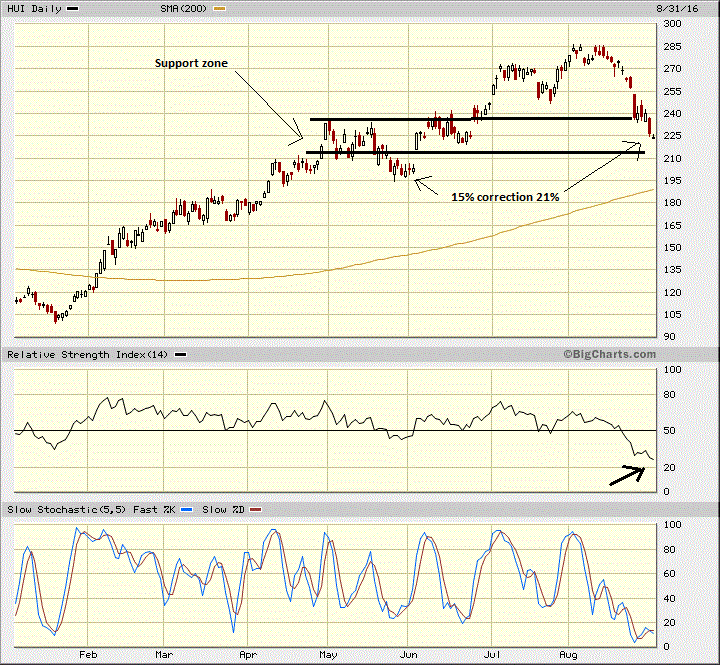
August 31st
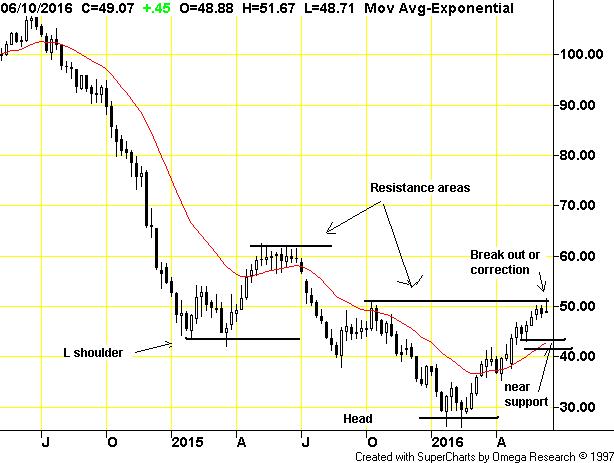
The chart below of the Gold Bugs Index shows we are in the 2nd correction of this Bull move. The one in May was about -15% and currently we are about -21% in the August correction. These are minor corrections when you consider the move up has been about 180% from the January bottom. Many indicators are pointing to a bottom in this correction but nothing has given a clear sign that a final bottom is in. RSI is very weak but sometimes hits 20.
Perhaps the strongest indication is we are in the support zone around 215 – 230. My feeling is Friday's job numbers may signal a bottom, no matter what the number. A strong number and a Fed rate increase is already priced in, a weak number and the US$ will sell off and Gold up.
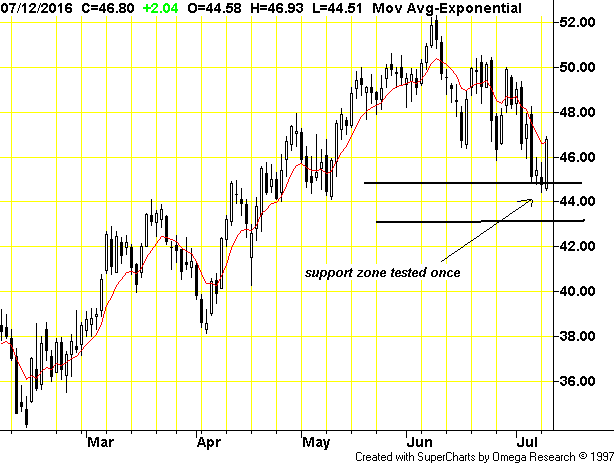
July 12th
June 13th we posted a chart of the day on Oil when it was around $51. We expected a correction down to support between $43 and $45. We have now seen this correction and bounce off of that support. We could see further tests of this support but we believe for the most part the correction is over and are looking at long entry points.
July 5th
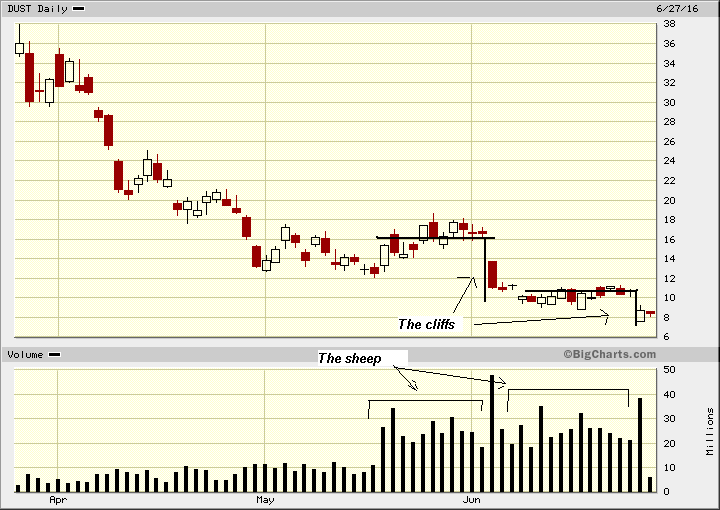
Honestly we are not picking on DUST traders, but see this as a good barometer to retail behavior
It is pretty sad that a number of investors have taken a bath 3 times. I would hope it is not the same investors over and over again, but this last plunge only took a week to happen but it looks like the daily number (volume) of sheep is up. The worst thing about this is the 30% or so plunges are occurring with gaps down at the open so no opportunity to cut losses with stop loss orders.
You probably heard the saying “Fool me once shame on you – fool me twice shame on me” There is nothing for a 3rd time but ad lib. I would say a 3rd time “you are the fool”.
There are many cliffs and steep slopes ahead for DUST. It is headed to $1 to $2 again and then they will adjust it back up 10 times to slaughter some more sheep.
July 4th
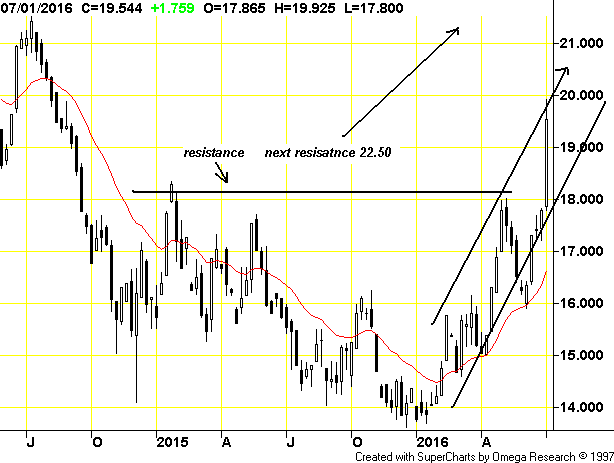
Silver prices broke through $18 last week and the chart is now looking like the Gold one with a significant higher high. Many believe it is Chinese demand driving Silver higher.
June 27th
Sorry, but we could just not help showing the DUST sheep being led over the cliff again last Friday. Fool me once and shame on you, but fool me twice and shame on me. Who is up for 3 times??
June 24th
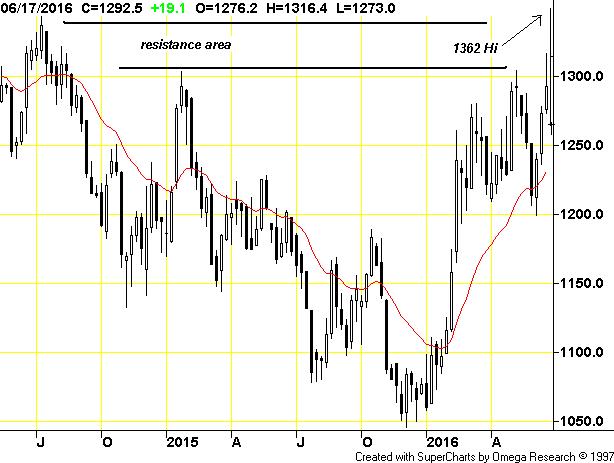
This is a weekly chart of Gold and I have drawn a crude candle in for today so far. Gold did pop just over $100 hitting a high of $1362 and around 8:30Am est it is about $1327. There is a near record short position on Comex by the commercials. Will be interesting to see if we have short covering in the morning. I drew in resistance area and there is more resistance around $1400. I expect we could now trade in a $1300 to $1400 range. The day is young, will be interesting.
June 23rd
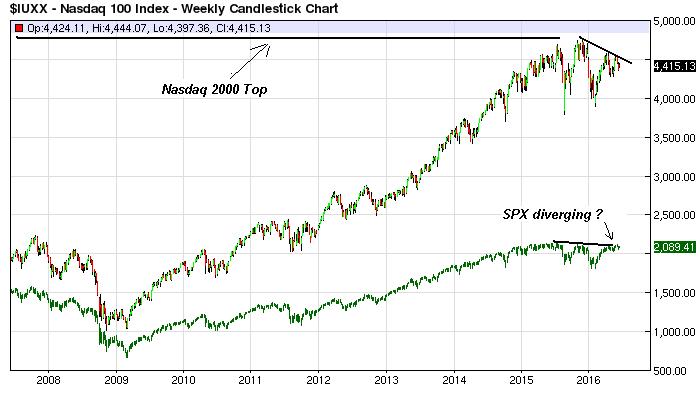
The Nasdaq has rolled over after hitting the old 2000 high. Is it confirming the S&P top of 2015 or is the S&P diverging, going to a new high and proving the Bull market lives on. The next couple weeks could be crucial to the long term picture or even today's Brexit outcome. Watching for a breach of 2140 or 2020.
June 15th
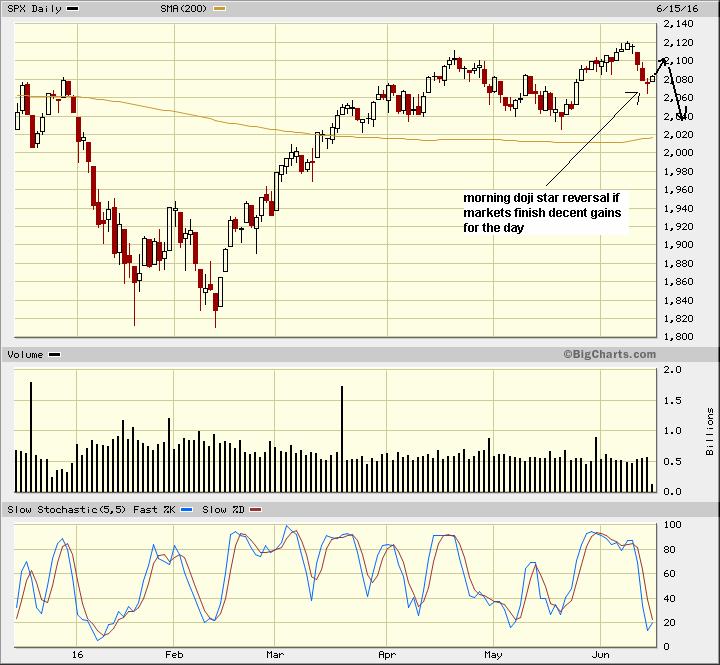
The S&P 500 could be forming a morning doji star reversal if markets stay with a good positive gain at the close. However, we see this as a short term rally. The big market players will try to keep the markets glued together until triple witching this Friday. After that we expect a larger correction, posibly quite a brutal summer. Stockastic also suggest some sort of rally. The idea is to enter short positions by weeks end, so we hope the market gets back to about 2100
June 13th
We presented this chart on June 8th and I drew in the weekly candle at that time. Oil was over $51 and we expected a correction. The weekly chart is now complete and we have seen a correction last Thursday and Friday to about $49 thus far. We expect this to be a mild correction with support in $43 to $45 area to hold. We also see some support around $47 which would be the bottom area of the uptrend channel not shown here.
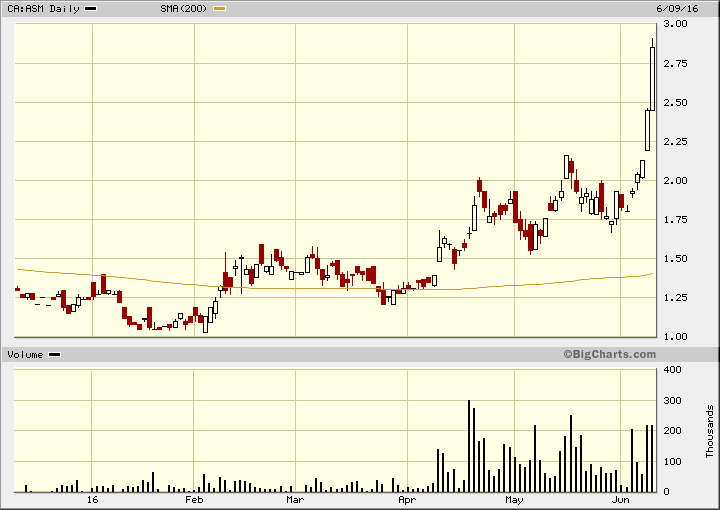
June 9th
Avino Silver TSX/NY:ASM Entry Price C$1.42. Avino has seen a strong up move with the PMs rally and news of commercial production Monday.
Nobody knows where eventual tops to a new bull move will end up. We use a strategy of trailing stops and part profits, mostly selling 1/3 position and anther 1/3 at some point. We have not taken profits yet and suggest holding and moving trailing stop/loss up to $1.95 giving wide room for further gains and consolidation.
June 8th
A lot of investors claim to fame is always making the last trade. They look at chart history and fail to see major turning points or trend changes where past patterns are no longer relevant
This chart is DUST etf that is 3 times short the gold mining stocks that were in a 5 year bear market. This has changed to a bull market but the huge volume indicates the sheep were led to believe there would be a big correction in the gold stocks, the cliff is obvious.